Forex Repainting Indicators: The Essence of Problem and Methods of Struggle
Forex Repainting Indicators or How They Actively Deceive Us
Let us make a few notes before starting.
Before using technical indicators, you need to clearly understand the main thing: The market key parameter is the price. It all depends only on price, not on the trader's abilities or the complexity of analysis or strategies. Any line, point, arrow, indicator, or histogram is just a reaction to a price change.
It means that if the price went up, the indicator shows it. The price “changed its mind” and went down − the indicator should show that. And do not let the tail wag the dog − the indicator always follows the price, not vice versa.
Why do you think most strategies contain multiple indicators? Right! They mutually refine the signal. You can open a trade only if the readings of all (or at least several!) indicators match.
The indicator's task is to assess the strength and trend direction, show strong price zones (support/resistance), find pivot points. But none of them affects the price − all indicators work only with factual information.
What Is a Forex Repainting Indicator?
In the financial market, there are concepts of:
- “Past” (the history of prices that does not change anymore)
- “Future” (prices that have not yet been formed by the market)
Any technical indicator is a mathematical calculation that works only with price history (with an array of prices Open/Close/High/Low are already fixed by the market).
It means that the indicator value is determined once at each moment and is no longer corrected. The current price does not affect the previous (calculated) values. Look at how a correct indicator should work.
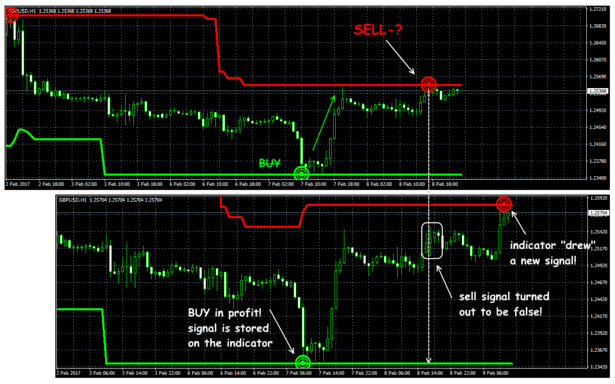 Signal “Disappeared” During Channel Boundary Correction
Repainting is when the indicator uses the current (and sometimes the «future») price to correct the previous, already fixed values. As a result, its external characteristics are corrected as new price ticks enter the system. The dynamics of such an indicator constantly «adapts» to the market. If a trading signal turns out to be unsuccessful, it “disappears” from the chart. Or a new signal appears on the already closed bars, for example, a colored arrow, but it is too late to use this market entry.
Сonsequently, the signals will look perfect on the price history, but such an indicator cannot be used for real trading.
Let’s take a closer look.
Zero Bar Concept
To understand the mechanics of the redrawing process, we need two essential terms. They are the following:
- Zero Bar, at which conditions for entering the market appear for the first time.
- Signal Bar, where the indicator shows a signal for opening a trade − the appearance of colored arrows or dots, changing the color of lines, sound signal, etc.
Warning! For an indicator that works correctly, there must be different price bars! In the calculation of non-redrawing indicators, a lag is specially created. So, the signal bar is ahead of the zero bar by at least one step.
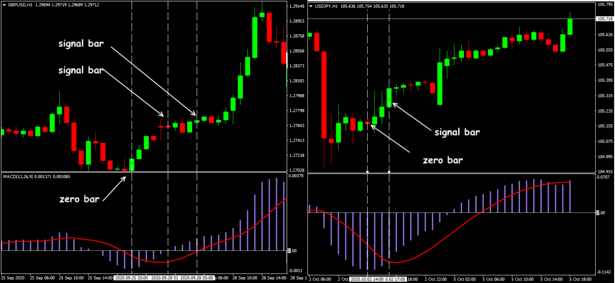 An Example of the Proper Trade Signal (After Zero Bar)
If the zero and signal bars coincide, there is a very high probability that the price will change direction, and the indicator signal will “disappear.” And if it is a multi-timeframe indicator, the trading signal correction can occur even before the current bar closes.
Hence, all indicators that show a signal to enter at a zero bar can be easily “blamed” for repainting.
What Is the Danger of Redrawing for Real Trading?
The problem is that the information about such an indicator misleads the trader. What’s the catch?
The redrawn indicator generates a trading signal. You enter the market, but the indicator “changes” its mind n the process of receiving new information. And oopsie! You automatically get a loss or at least a dangerous trade.
Besides, repainting affects the location of support/resistance zones and pivot points. They negatively affect the overall assessment of the market situation. For example, you calculate TakeProfit/StopLoss levels considering key areas, but the price reverses at entirely different points in real life. As a result, either your profit is too small, or StopLoss is placed too far.
A separate problem is redrawing in multi-timeframe indicators (MTF) that use data from other timeframes (usually larger). For example, a simple SMA on the H1 chart can display a similar line from the M15 and D1 timeframes in separate windows.
The paradox of the situation is that when an MTF-type indicator is plotted on a lower timeframe chart. In this case, its historical values are displayed as if the Open/Close/High/Low values of the higher timeframe bar were already known. Thus, trading signals of multi-timeframe indicators should be interpreted considering such “future” prices.
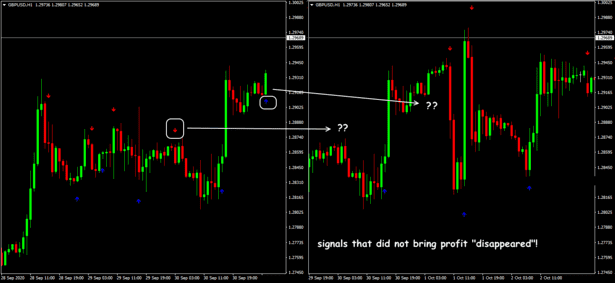 An Example of the Arrow Indicator’s Incorrect Signals
Indicators without repainting use only closed bars for calculation. Therefore they do not change their values. If the indicator uses the Open price in its calculations without redrawing, its characteristics will be constant after the first tick in the period. If the Close price is involved in the calculation, the correction within the current bar is considered normal.
There are exceptional cases when repainting on the price history is allowed, but let's talk more about that later.
For now, let's look at the reasons for this effect.
Cases of Repainting
Unintentional or Technical Redrawing
Conventionally, several options can be distinguished.
Indicators With Allowed Repainting
There are indicators in which the repainting effect is considered quite legitimate, but their signals must be used correctly. These are technical instruments, that are calculated using local max/min prices. It is quite logical that these values can be corrected in the price history.
-
Fractals
Recall that a classical fractal structure consists of at least 5 bars, and the central one is just a local extreme.
The fractal sign will appear when the last two bars are formed, meaning that this reverse signal is always lagging. If the fourth or fifth bar in the pattern closes above/below the central bar (the local extreme is updated), the structure is broken, and the fractal arrow may “disappear.”
But this does not mean that the indicator is not working correctly. It is assumed that the trend continues until an inverse fractal appears. It is just that the current pattern turned out to be weak.
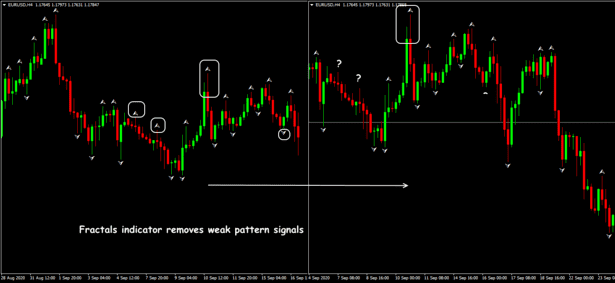 Fractal: An Example of Permissible Technical Redrawing
-
ZigZag
The indicator also plots trend sections based on local extremes. In this case, carefully study the settings.
The number of bars determines the range for finding max/min. Until a new extreme is found, the indicator line current section is corrected and follows the price. The appearance of max/min completes the line segment, reverses, and starts a new segment.
Closed ZigZags should not be corrected. ZigZag must react to a new extreme. However, at the same time, it must continue the previously formed section of the chart and not cancel the trading signal. The trader should take into account this feature of the indicator.
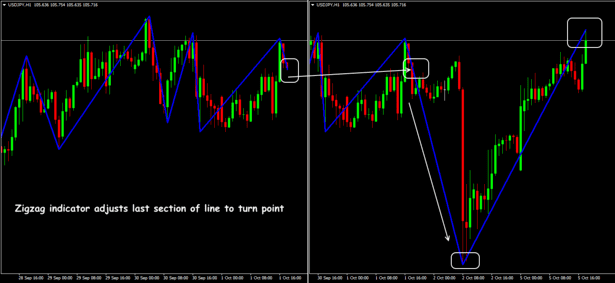 ZigZag: An Example of Permissible Technical Redrawing
-
Moving Average, MACD, RSI, Fibonacci levels
Note! The correction of the current bar during an open period is not considered a redrawing.
Sometimes all prices are included in the calculation methodology. The most recent data, as a rule, have a stronger influence on the final result. Then it is the last bar that can determine the indicator readings. For example, if the current bar first shows a downward movement (bear) but then turns upward (bull), the indicator may change its dynamics.
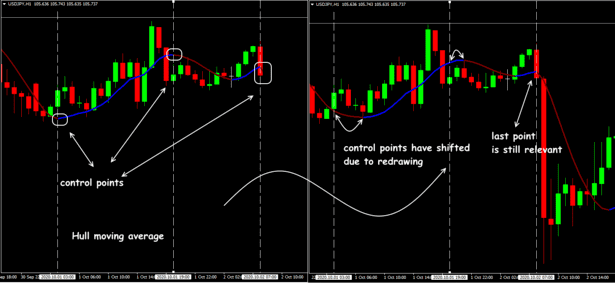 Incorrect Color Replacement of the Indicator Line
Indicators that use the dynamic average calculation apply the current price. So, you can see how the edge of the MA line moves until the timeframe is closed.
The same effect is seen in the last column of the MACD chart. However, there are variants of the moving average. For example, the Hull Moving Average (HMA), in which the repainting is clearly visible, the indicator line changes the pivot point (color change) on the price history (watch for yourself!).
The more complex the MA calculation, the higher the probability that the line will correct. Check, for example, the TEMA or DEMA indicators.
Note! Even if it seems that you see a “clear” signal, entering a trade on the current (zero) bar is not allowed.
Invalid Program Code
The indicator algorithm (most often, custom) contains serious errors. It leads to an incorrect display of signals. Some enterprising programmers even try to sell such failed “experiments.”
Too Complicated Calculation
Errors in the program code can be caused by a lack of understanding of complex mathematical and statistical functions. A universal algorithm is complicated to implement, so such situations often arise. You can solve the problem by analyzing the program code and qualitative testing on the price history in different trading conditions.
Do you doubt the reliability of the indicator? Want to check if there is no redrawing? Need an expert programmer to develop a custom Forex indicator? We will do it for you! Just fill in a form and get a free estimate.
Invalid or Intentional Repainting
-
Developer fraud
This effect is intentionally included in the settlement engine.
Forex repainting indicators are often offered in paid trading strategies: The developers carefully create the financial “Grail” image. The results of backtests are in the form of reports or videos proving that all signals are super profitable and the indicator never makes mistakes.
The “Grail” generates a signal and then either deletes or carefully redraws it to the most successful entry points. Moreover, if the users do not open live trades but simply observe the dynamics, they may not even notice the testimony’s falsification.
Such a “business” can be called fraud, false advertising, etc. However, the market for such software and services is not regulated and cannot be controlled by any means.
So do not ever buy a pig in a poke − you will have to defend yourself (read on)!
-
Fraud broker with quotes
If you still do not know what requotes are, then you are lucky with a broker.
The second method is that the broker offers the client its own price stream. That is, it can constantly intervene − to correct or delete historical quotes. As a result, even the indicator without redrawing can show different results.
Slippage and requotes lead to the platform slowing down, the price lagging, then catching up sharply. The indicator has to make mistakes, lag, and adjust its values. By the way, on a demo account with such brokers, everything works accurately and beautifully.
How to fight? Choose a broker that you trust with your money carefully.
How to Deal with Repainting?
The easiest way to check is to test the price history independently is through one of the Forex backtesters, such as Forex Tester or Strategy Tester in MetaTrader© 4 (5). You will need at least a compiled indicator or expert advisor (*.dll, *.ex4, or *.ex5 files), after which we run several visual tests and observe. It is recommended to choose a low testing speed and several timeframes (starting with M1) to not miss anything.
If the developer refuses to provide an indicator for testing, ask directly whether the indicator is redrawn or not. And ask where you can see the real backtest. The chances of getting an honest answer are minimal. In this case, it is better not to work with such a tool.
Sometimes special protection against testing is built into the program code. Externally, the test is executed normally, but redraw situations are deliberately ignored. In this case, you can put it on a small real account and watch it. Yet, we believe that it is better to refuse to use such an indicator.
If you have personal programming experience and the indicator source code, you can try to get rid of redrawing. Still, will its signals be accurate after such an adjustment? You will have to retest.
What Is the Result?
The bottom line is there is no perfect indicator. If everyone makes the right decision, there will be no financial market. Of course, non-redrawing indicators cause fewer problems, but their signals are necessarily delayed.
In any case, each indicator that you plan to use in your trading system must be checked for repainting by all available methods:
- Demand full disclosure from the developer.
- Observe the behavior of the indicator on real prices.
- Checking through the strategy tester is a must.
Otherwise, get ready for losses.
When you trade, you reign − with 4xDev programming services.

Do you doubt the reliability of the indicator? Want to check if there is no redrawing? Need an expert programmer to develop a custom Forex indicator? We will do it for you! Just fill in a form and get a free estimate of the price and time needed to develop the desired tool.
