Ichimoku Indicator: The Powerful Strategy of the Wise Warrior
- How to Use the Ichimoku Indicator: A Quick Guide
- Logic, Purpose, and Calculation Methods
- Parameters and Settings
- Indicator Trading Signals
- Using in Trading Strategies
- In Conclusion. What Should I Do?
How to Use the Ichimoku Indicator: A Quick Guide
Traders spend centuries looking for the most profitable strategy.
Why go so far if you can get everything here and now? All the popular platforms have a tool (aka a ready-made trading system) built into the basic trading bundle. Imagine you can get it without spending a single dime!
The Ichimoku method contains one unique indicator. It was created in Japan to trade the Japanese Nikkei index.
The indicator applies the most balanced mechanism for analyzing price movement. That is why it is also called "a market equilibrium indicator".
Yeah, it may seem that its graphical schemes are too intricate. However, do not let external complexity scare you away! The efficiency of such trading charts is really high.
Logic, Purpose, and Calculation Methods
The Ichimoku Kinko Hyo indicator draws 5 major lines on the price chart. Do not let the sly Japanese names confuse you since line calculating is an easy-peasy process.
Tenkan-sen
It is a reversal or “short” trend line colored in all shades of red. It is calculated as a usual moving average (half the High+Low amount) over the first period. Its default value is 9.
This line is the main trend indicator. The greater its tilt angle, the stronger the current trend. Moreover, it functions as solid dynamic support or resistance.
Kijun-sen
It is a standard or “long” trend line calculated as a moving average with a period. Its primary color is blue.
It is an indicator of the mid-term trend. The uptrend occurs when the price is above this line. If it is below, there is a downtrend.
Breaking down the Kijun-sen zone is a strong signal to enter the current trend.
ChinkouSpan
It is a Close price or lagging line shifted from the current price to the second-period distance.
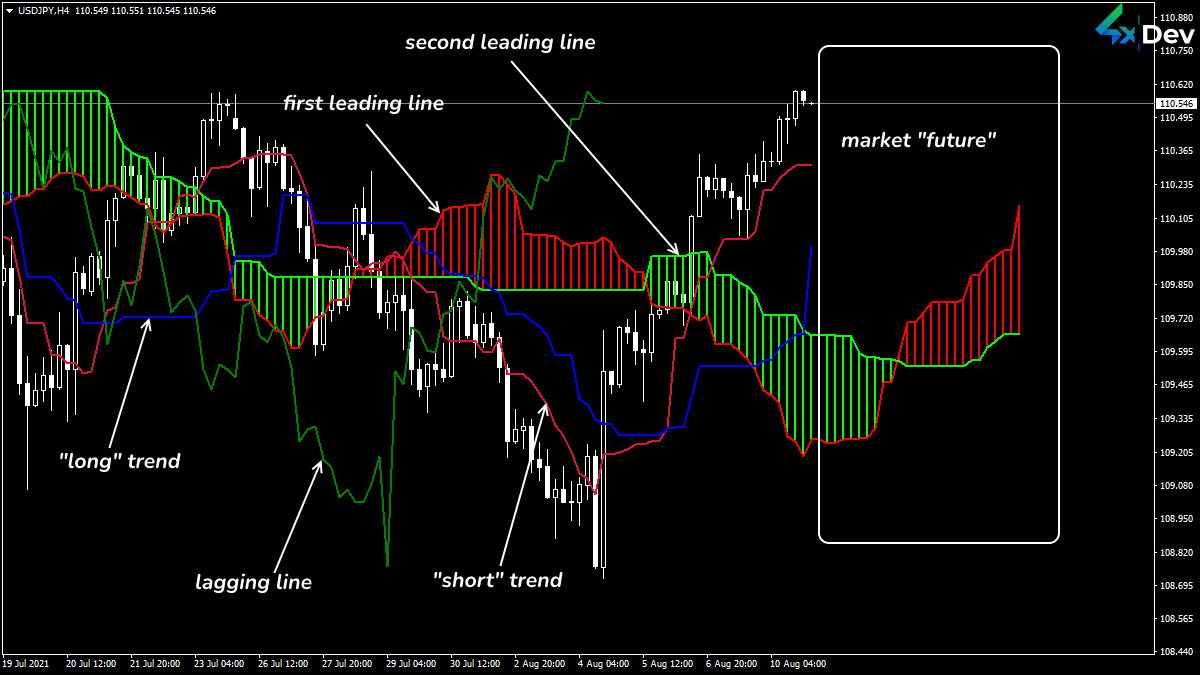 Ichimoku Lines’ Functions
SenkouSpanA
It is an upper or first leading line of the future dynamics colored in red.
You can calculate it as the average price range of the Tenkan/Kijun lines. However, prepare for the line to move forward into the market “future” by the second interval size.
SenkouSpanB
It is the lower or second leading line colored in green.
It is calculated as the average over the second interval (its default value is 52). Moreover, the line is shifted into the “future” by the same number of bars.
Kumo Cloud
It is a price chart area with SenkouA and SenkouB borders highlighted with color shading. Its color depends on the relative positions of the lines.
While the price is inside the Cloud, the market is in a flat or unstable trend. Kumo borders are strong resistance zones.
As long as the price is above the Cloud, the market is bullish. If it is below, the market is bearish.
Let’s continue!
Parameters and Settings
The full stock market cycle is 1 year. That is why, in the standard settings, we can use intervals of:
- 52 matching the number of trading weeks in a year.
- 26 matching half of this period (6 months).
- 9. This parameter is an experimental one. It changes with custom settings.
Ichimoku signals are processed more accurately on weekly bars.
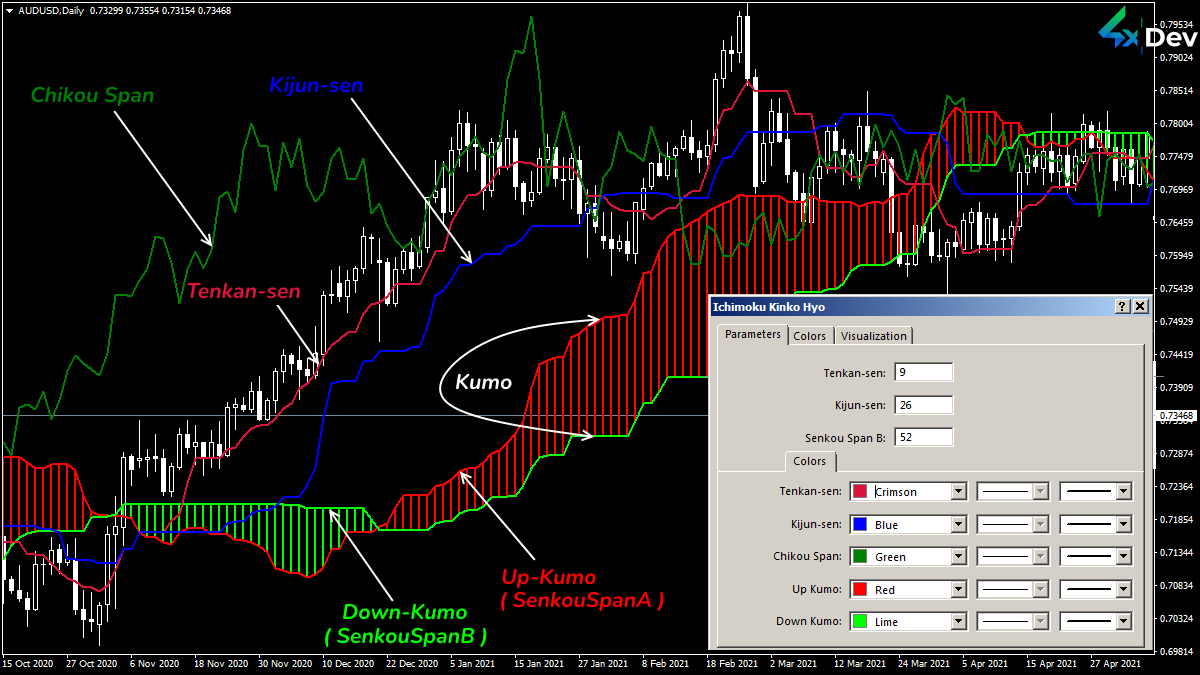 Parameters and Installation on MT4(5)®
Note! Ichimoku math applies mid-term and long-term trading as a background.
You should reduce the typical parameters to perform intraday trades. Then the system will provide excellent signals.
A crash can occur only under speculative market conditions, with price fluctuations on the news.
You can google to find more advanced and exclusive Ichimoku versions. Some of them allow disabling certain lines. In this case, the indicator will depict only necessary for your strategy lines.
For trading gourmets, we have prepared the most delicious options: hybrid Ichimoku indicators. For example, you can mix Ichimoku with oscillators. However, we strongly discourage newbies from experimenting.
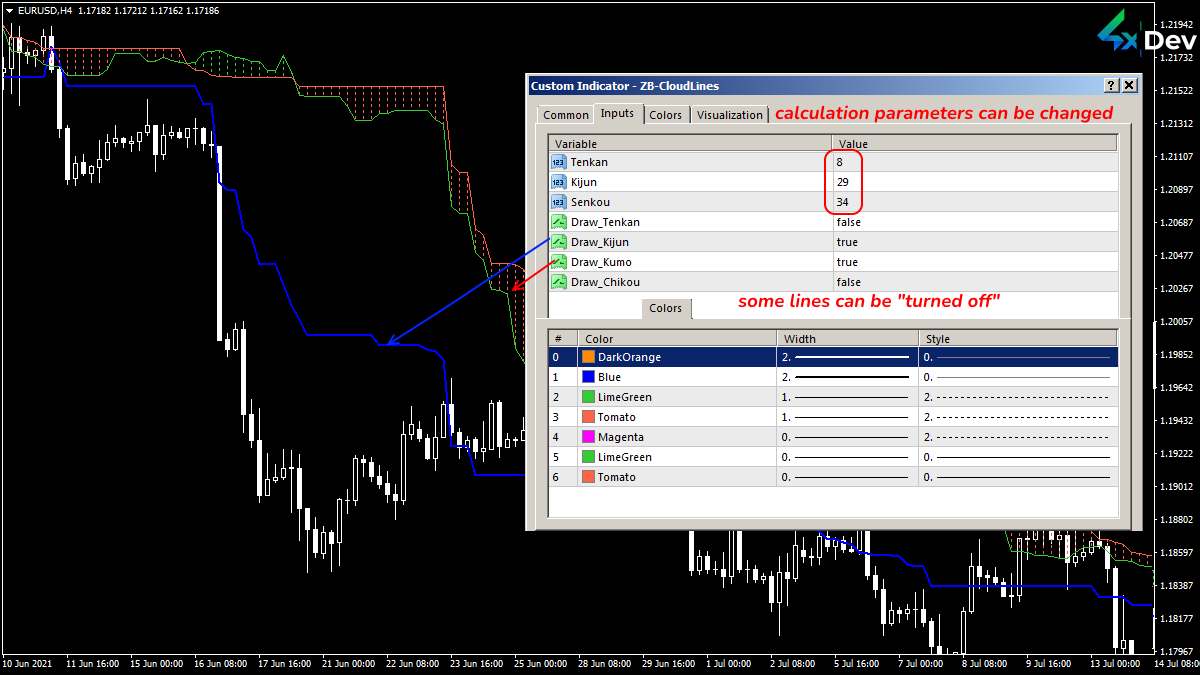 An Example of the Custom Ichimoku Indicator
You can change the calculation parameters and color scheme to your liking.
You do not have to follow the classic proportions, especially in the more volatile market. The backtesting of a specific asset/period on historical price data allows you to identify optimal parameters.
Let’s take a closer look at the standard Ichimoku schemes!
Indicator Trading Signals
The recommended analysis period is H4 or D1. Reduce the timeframe for a position opening to H1.
4 basic trading tactics and their combinations are involved here:
Tenkan-sen and Kijun-sen Cross
It is the most reliable scheme. When the crossing occurs, a signal appears. Analyze it due to the general market picture.
- BUY: Tenkan crosses Kijun from the bottom up, creating the “Golden Cross” pattern.
- SELL: Tenkan breakdowns Kijun high to low, generating a “Death Cross” pattern.
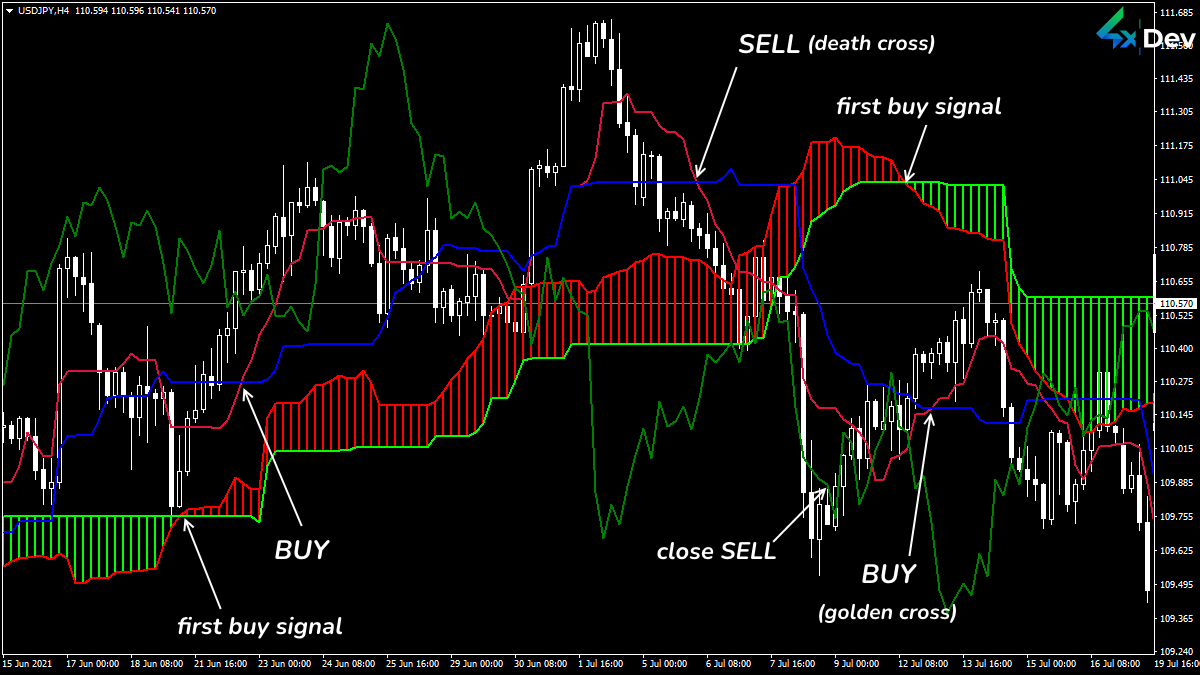 TenkanSen/KijunSen Cross Signal
After the previous candle is closed, the order is opened in the direction of the cross point. Place a StopLoss beyond the opposite Kumo border (or according to the money management rules).
Kijun-sen Line and Price Cross
The only weak point of this scheme is a breakdown of speculations with a fast rollback. This tactic is less reliable in short-term periods.
- BUY: The price breaks the line from the bottom up. The bar closes behind the line.
- SELL: The price crosses the line from the top down, and the bar closes below the Kijun-sen line.
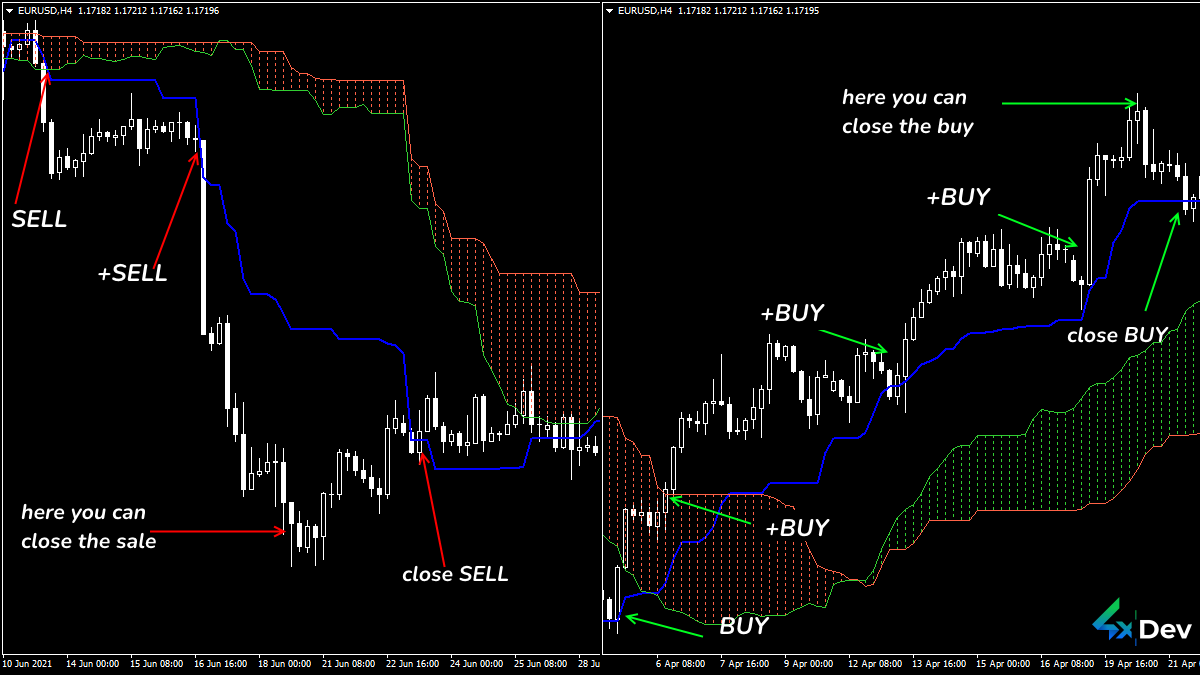 Price/KijunSen Cross Signal
The trade is opened after the crossing (if the previous candlestick has been fixed). Manage the location of solid support/resistance levels with additional indicators.
Place a ten-pip SL in the opposite direction from the line. Move your dynamic StopLoss along the Kijun line.
Note! You can assess the signal reliability of these 2 schemes in the same way:
- Strong signal. To BUY, the crossing point must be above the Kumo Cloud border. To SELL, it should be under the lower boundary.
- Neutral signal. Lines cross inside the Kumo zone.
- Weak signal. To BUY, the crossing should be below the lower Kumo border. To SELL, it should be above the upper one.
Close your trades when there is a reversal-line crossing (or by TakeProfit due to your money system).
Trading Inside the Cloud and on the Breakdown of Its Borders
The Kumo zone is quite large. Trades are allowed inside the Cloud and on the breakdown of SenkouSpanA/SenkouSpanB borders. However, it is a weak scheme.
We trade on a breakdown: to BUY, the bar should be closed above the upper border; to SELL, there is a bar close below the lower boundary.
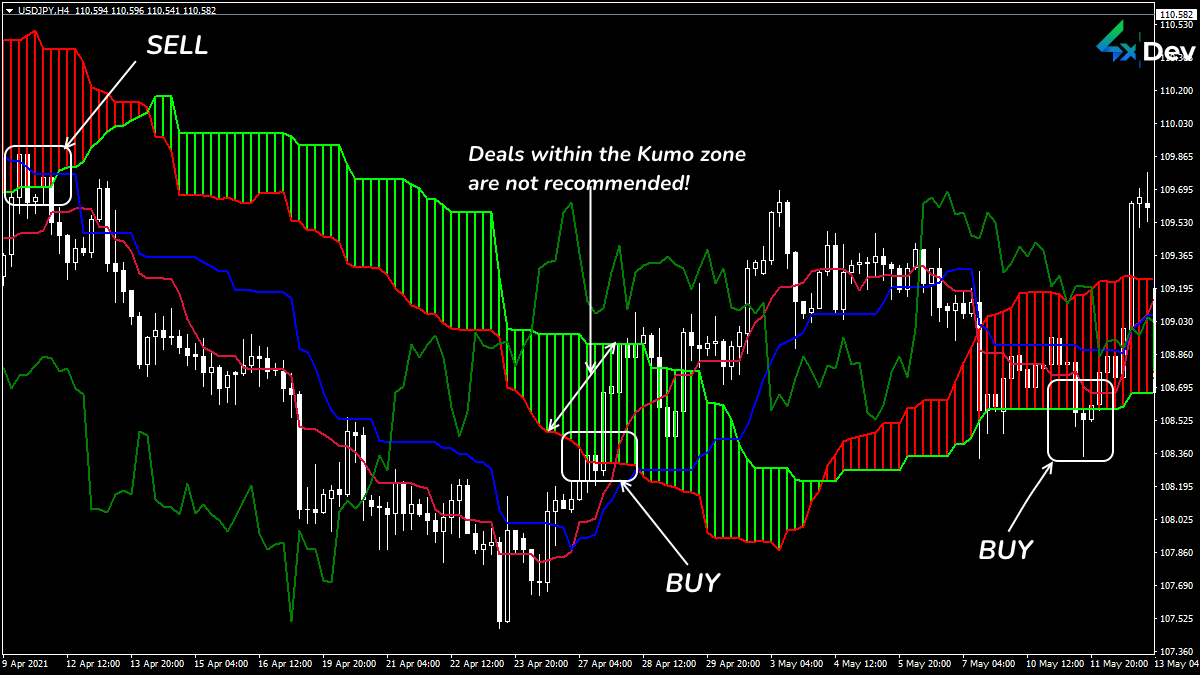 Kumo Zone Breakdown Signal
If the BUY is opened inside the Cloud, place the SL outside its lower border. If a SELL is opened, you should set the SL behind the top one.
Put the TakeProfit beyond the opposite border of the Kumo zone (20—120% of the Cloud range).
Consider the Kumo “mood” if the Cloud is bearish. It confirms that the signal moves down. If the color of the Cloud does not match your intentions, wait for better conditions.
SenkouA and SenkouB cross
It is a strong signal of a trend reversal or rollback towards the SenkouA line.
If the SenkouA crosses SenkouB from top to bottom (and the Cloud color changes), buy. If the opposite is true, sell.
The tactic is unreliable since the SenkouA/SenkouB lines are drawn based on the predictions of the dynamics. However, the current price is shifted from it by as much as 26 periods. Predicting the market “future” for such a period is dangerous.
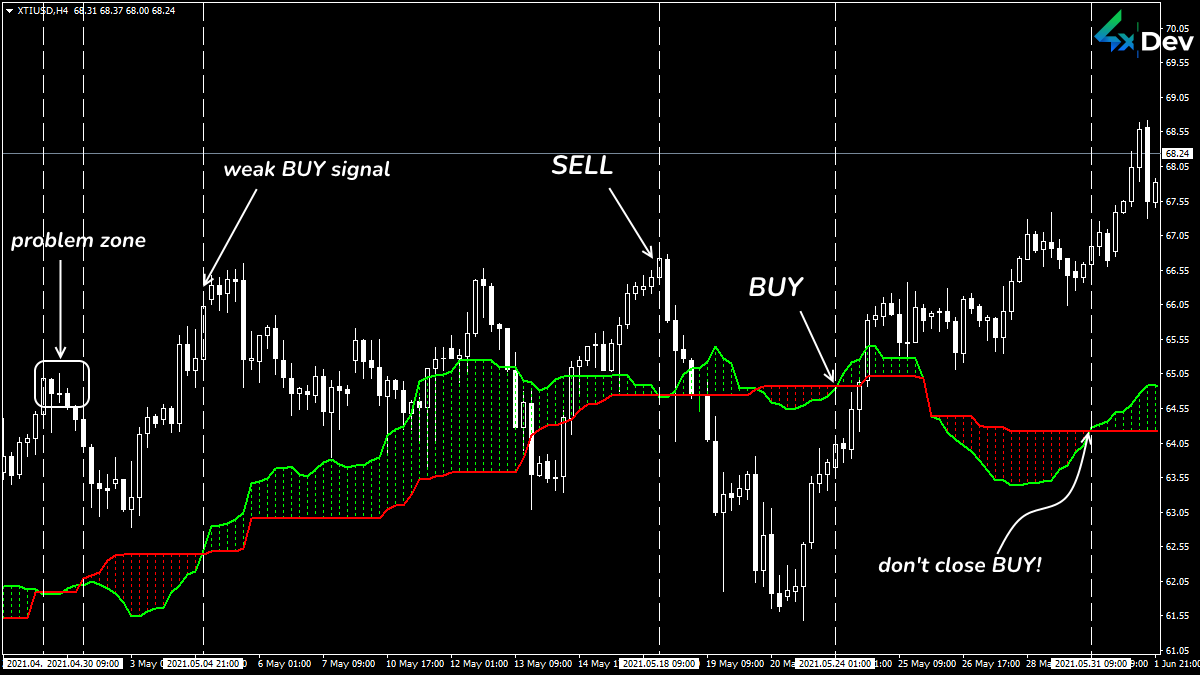 SenkouA/SenkouB Cross Signal
You can only trade if the shading color of the Kumo zone changes.
Does the color transform from red to green? It means the signal is bullish.
Does it change from green to red? This signal is bearish.
Note! Do you have questionable matters? Consider the ChinkouSpan line. If at any BUY signal ChinkouSpan moves above the price, this confirms the trading signal. Any SELL signal is more reliable if the ChinkouSpan line is below the price at the entry time.
Using in Trading Strategies
Use the indicator without any partners when performing mid-term trades. Learn to understand what you see on the price chart. Any challenging situation can cause order cancellation.
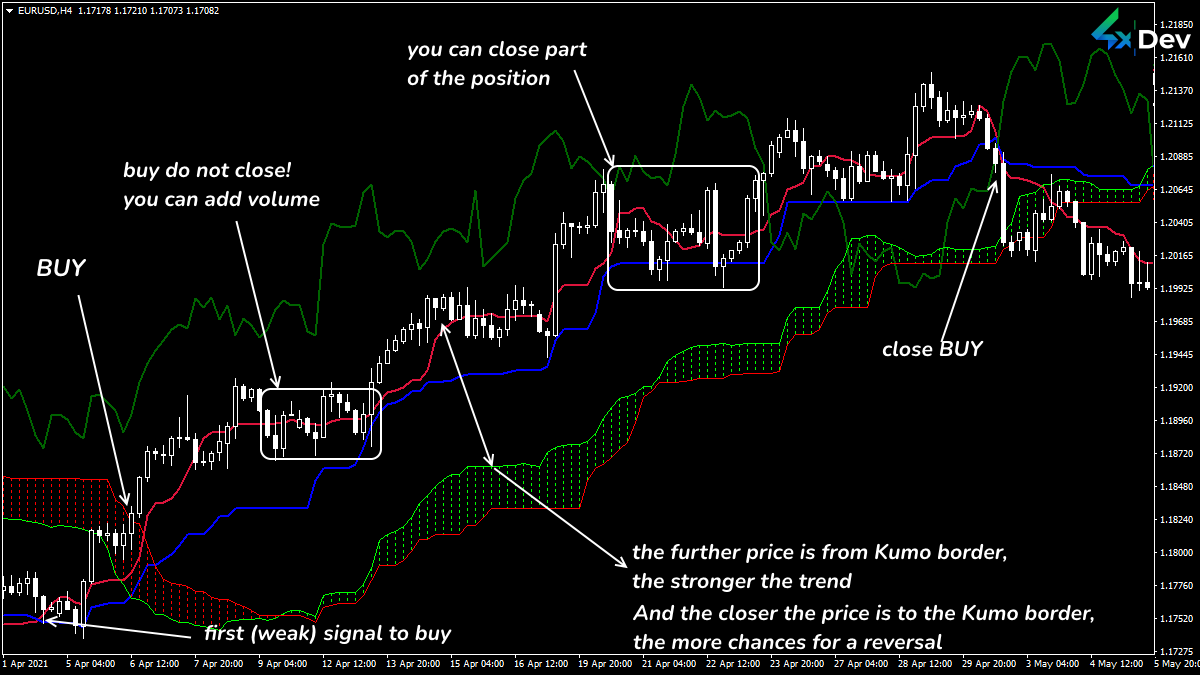 Ichimoku Scheme for Trend Trading
Except for the last forecast zone, lines are not redrawn.
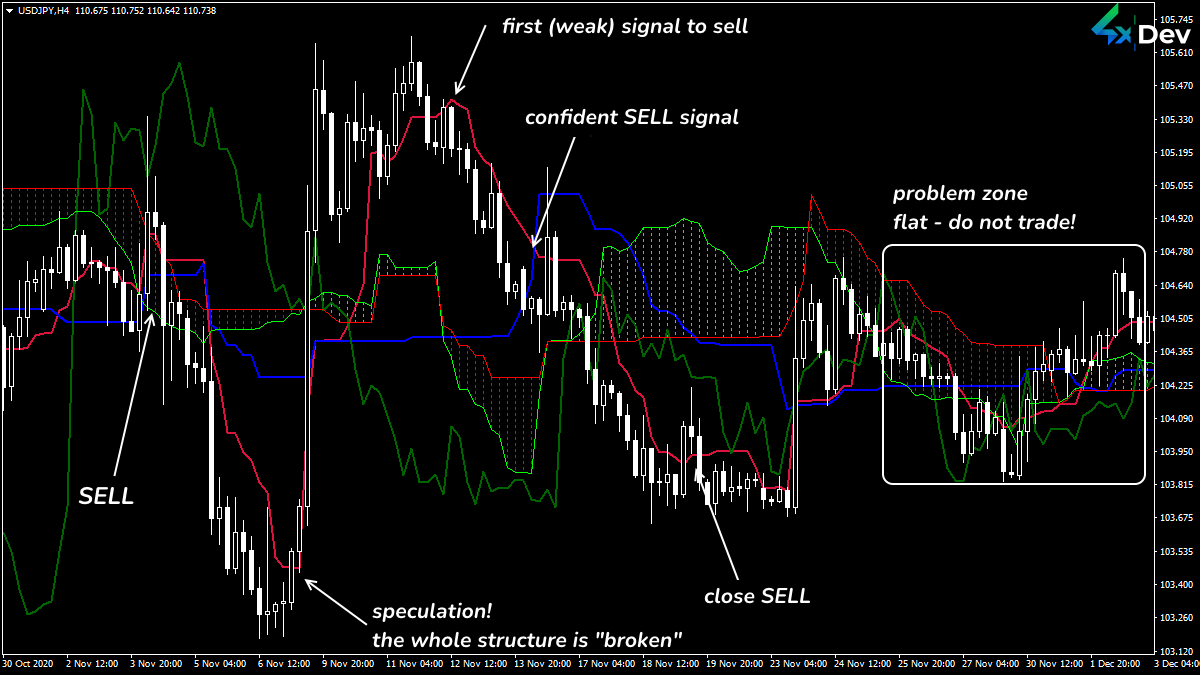 Ichimoku Reversal Signals
The indicator represents the flat periods. However, its logic crashes down on speculations. Do not wait for the lines to build a reverse signal. Fix the trade partially as it moves along the trend.
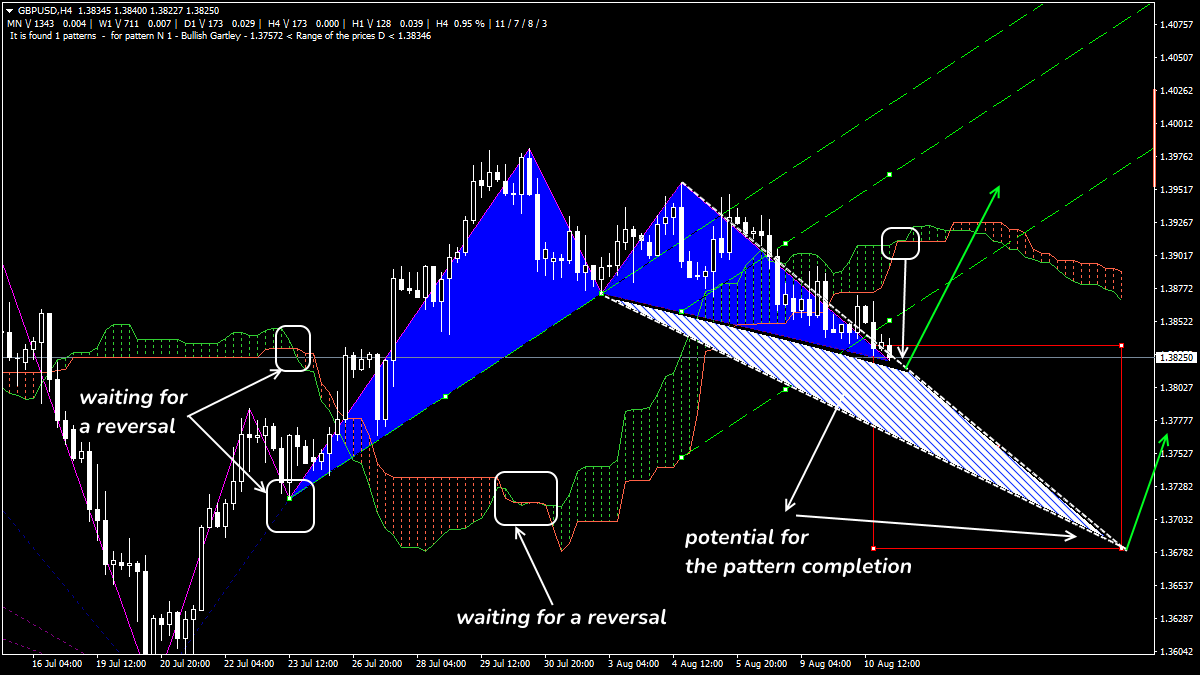 An Example of the Ichimoku+ZigZag Strategy
In Conclusion. What Should I Do?
All the Ichimoku strategies combine the advantages of a trend indicator with Moving Averages. This “baby” can even replace the channel indicator.
Ichimoku is compatible with graphical patterns. Its lines coincide with the 50% Elliott Wave responses.
Note! The indicator does not consider trading volumes when calculating lines. Therefore, equip your short-period trading systems with oscillators (Awesome) to clarify entry points.
Studying the Ichimoku Kinko Hyo indicator takes time. But if you accurately configure it, the efficiency of its signals will be more than 80%!
Understanding Ichimoku logic is a fancy-pansy, super modern, and professional skill. Do not hesitate to take it!
4xDev gives you trading tools of the millennium. Try our version of the Ichimoku indicator right now! Or order custom tool development!

Do you doubt the reliability of the indicator? Want to check if there is no redrawing? Need an expert programmer to develop a custom Forex indicator? We will do it for you! Just fill in a form and get a free estimate of the price and time needed to develop the desired tool.
