Hybrid MACD: Build a Perfect Strategy with One Indicator
- Choosing MACD or Why You Don’t Need to Complicate Your Technical Analysis
- Logic, Purpose, and Calculation Methods
- Parameters and Settings
- Indicator Trading Signals
- Using in Trading Strategies
- In Conclusion. What Should I Do?
Choosing MACD or Why You Don’t Need to Complicate Your Technical Analysis
Once upon a time, an amateur trader, Gerald Appel, created his unique MACD for a changing stock market. He applied it as an oscillator.
Forex traders were there in a flash. They have been glad to borrow this helpful innovation. Yeah, who would not be? Moreover, traders discovered product features.
The up-to-date MACD indicator:
- Shows pivot points.
- Assesses the risk level.
- Identifies the trend, its speed, and direction.
Note! You must be experienced and careful when using MACD on assets with speculative volatility.
Logic, Purpose, and Calculation Methods
This indicator is considered a hybrid one since it contains a trend+oscillator mixture. Actually, MACD is just an improved visual representation of the exponential moving average interaction.
The MACD (Moving Average Convergence/Divergence) indicator evaluates and displays the relative position of fast and slow-moving averages. The breakdown point of the central line by the indicator histogram is similar to the regular MA cross on the price chart.
The MACD idea is that the price is constantly striving toward the average value. It is moving toward a stable bull/bear balance (or so-called “fair price”). Nobody should take advantage of somebody.
The greater the difference between moving averages, the further the market moves away from the fair price. The balance is crumbling, and the market becomes more bullish or bearish.
The indicator applies a bundle of 3 EMAs to calculate. Thanks to this, you can identify the dominant trend from the “white noise” of quotes.
MACD signal lagging is the key disadvantage of the approach. When scalping, such a thing interferes. However, such a lag is not critical in trend trading.
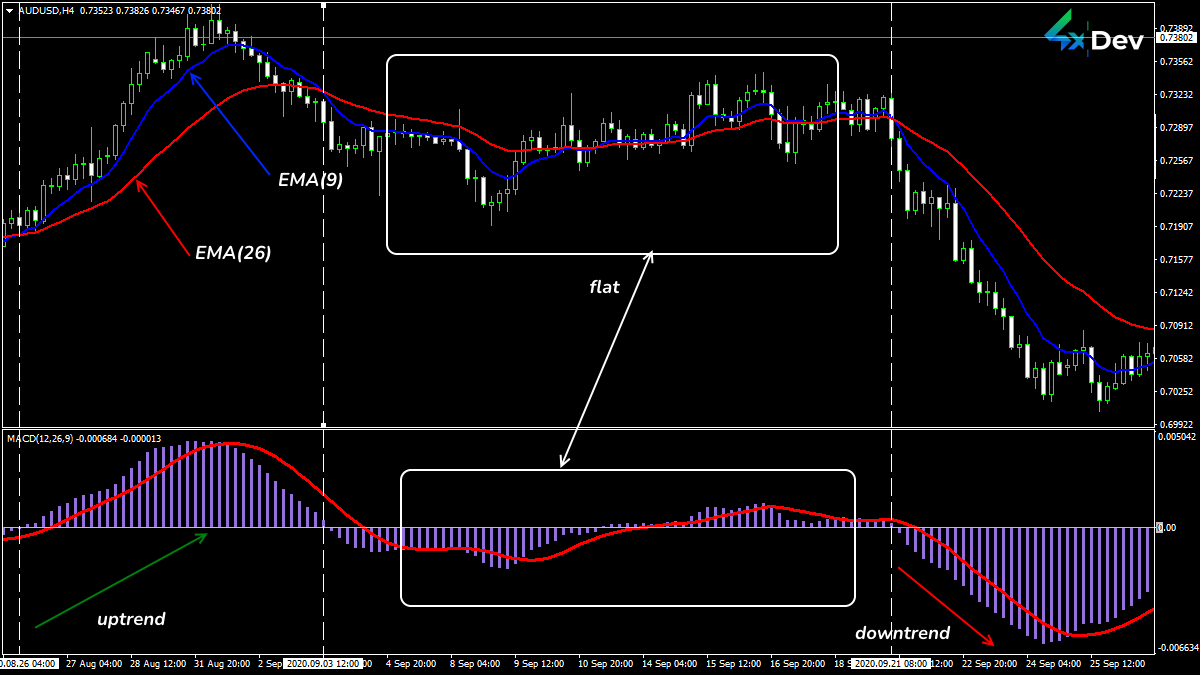 The Standard MACD Indicator in Operation
The main calculating principle is the double anti-aliasing mechanism:
MACD = EMAl(P, close) — EMAs(P, close)
EMAl is long, and EMAs are moving averages. The result gives a MACD fast line (or a histogram).
As an additional filter, this value is averaged again. As a result, we get a signal MACD line:
Signal = SMA(MACD, Pa)
SMA is the moving average, and Pa is the signal line period.
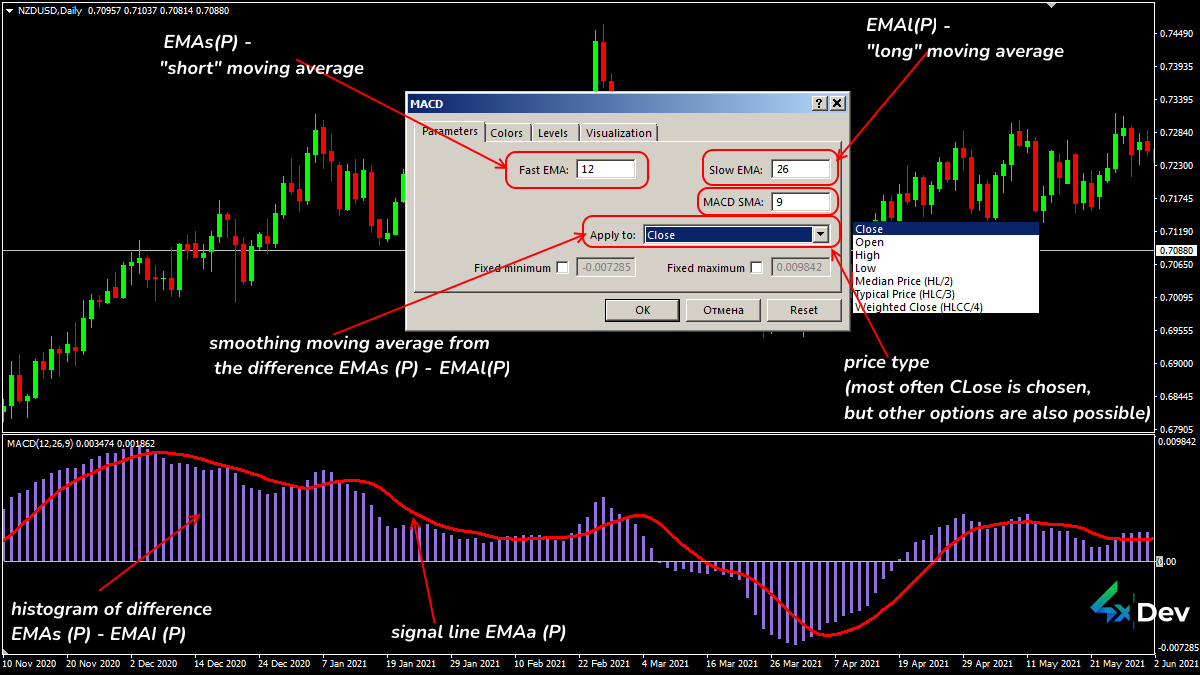 Standard MACD Parameters
Thomas Asprey, while studying the indicator’s leading properties, created a MACD histogram. It is based on the difference between the MACD final value and the signal line:
MACDHistogram = MACD — Signal
If the MACD final value is greater than the fast EMA value, the histogram will be positive (it will be located above the balance line). If it decreases, the histogram will be negative.
It is as easy as winking. Don’t you think so?
Parameters and Settings
Standard MACD is a part of every trading platform bundle.
The indicator is in a separate window below the price chart. Such a location is typical for the oscillator.
Stock traders prefer the custom linear MACD since the crossing of two lines gives a strong trading signal. The histogram is more popular on Forex.
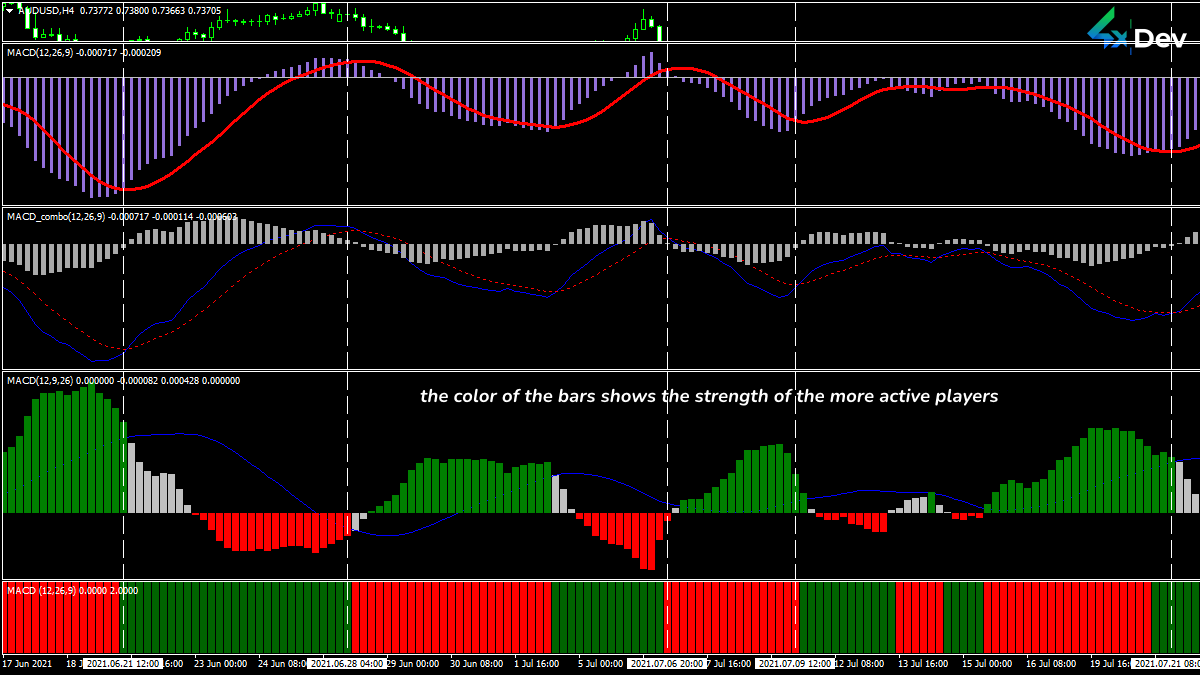 The MACD Indicator Versions
Sometimes, you can come across hybrid versions located directly on the price chart.
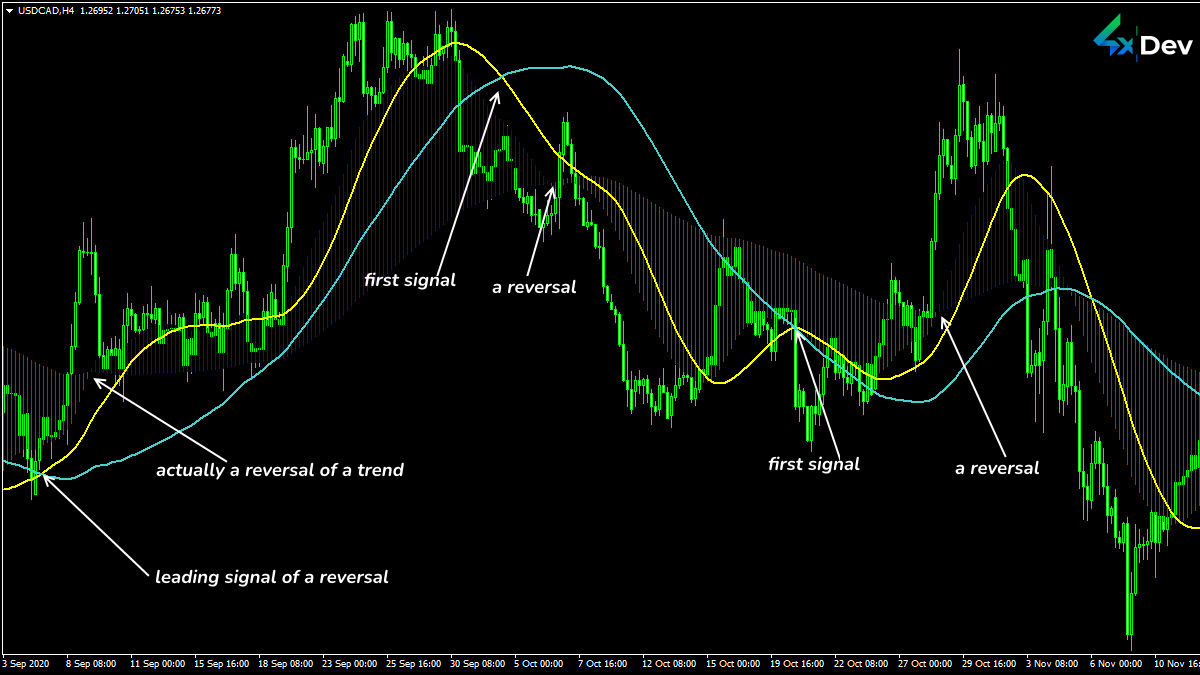 VisualMACD Displayed on the Price Chart
Indicator components are around the zero/balance line. The histogram amplitude gives an idea of the price range.
Parameters adapt to the analysis period and volatility. The higher the timeframe, the slower moving averages you should include in the calculation. And vice versa. The shorter the MA period, the more unreliable signals the indicator will show.
Note! Do not use the indicator for periods less than M30. The MACD structure breaks down during the speculation period (news, week starting). Do not trust its signals during mentioned events.
Let’s consider several aspects concerning MACD parameters:
- Default values are optimal for H1 on any assets with stable volatility.
- The Awesome oscillator is a modified version of the MACD indicator (5;34;1; MedianPrice) with no signal line.
- Mr. Appel recommended the MACD configuration (12;26;9; Close) for sellers only. He believed that the MACD configuration (8;17;5; TypicalPrice) is more suitable for buyers.
The MACD indicator provides a lot of entry points. Let’s take a closer look!
Indicator Trading Signals
There are trading ideas that allow using MACD without additional indicators:
Trend direction assessment
The histogram direction indicates the current balance in the market.
Let’s analyze:
- If the histogram is above zero lines (positive), the buyers dominate the market. There is an uptrend. The market is bullish.
- If the histogram is below the balance line (negative), the sellers dominate the market. There is a downtrend. The market is bearish.
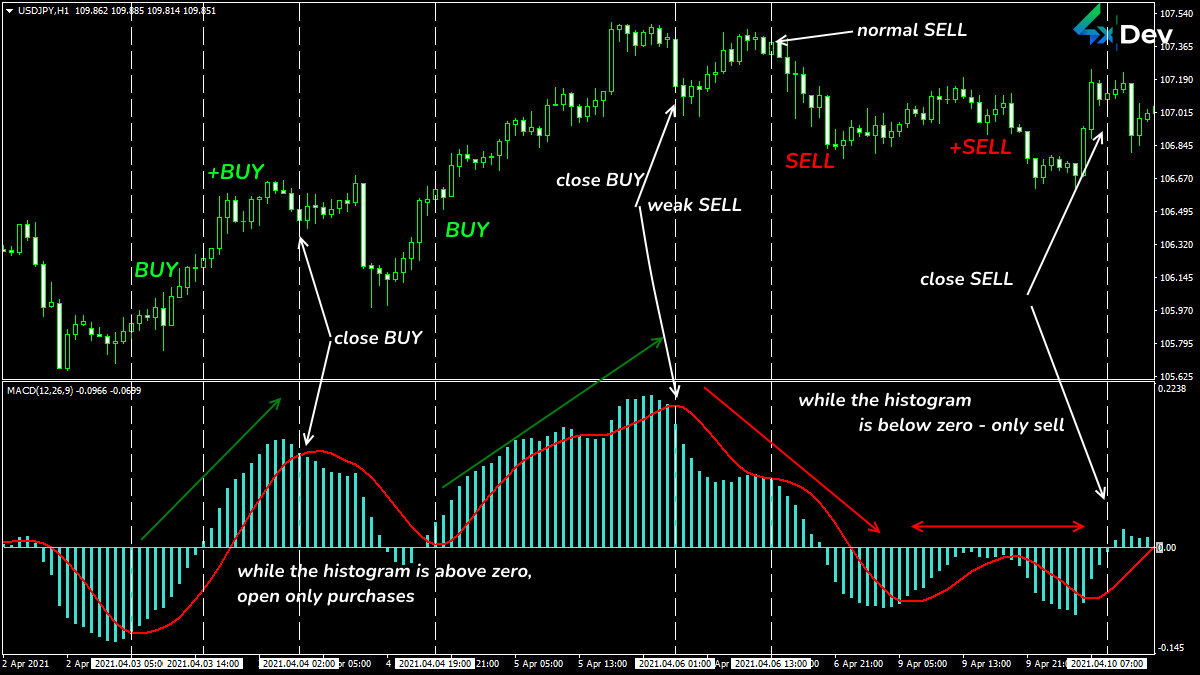 MACD Signals for Trend Trading
The histogram dynamics show the direction and speed of the trend. For example, the greater the bar amplitude, the stronger the current trend.
Histogram upward slope means that the bulls are more active. The uptrend intensifies. A consistent downward movement of bars indicates that sellers captured the market. There is a downtrend.
According to the mid-term trading logic, the first trading signal changing the histogram slope direction is the first trading signal. The main trading situations are:
- The price rises. However, the MACD histogram is turning down. Move the StopLoss closer to the open trade and look for entry points to SELL.
- If the histogram turns upwards on a bearish trend, reduce sales and wait for the moment to enter BUY.
Use the indicator with a multi-colored histogram. This way, you can better identify the pivot point.
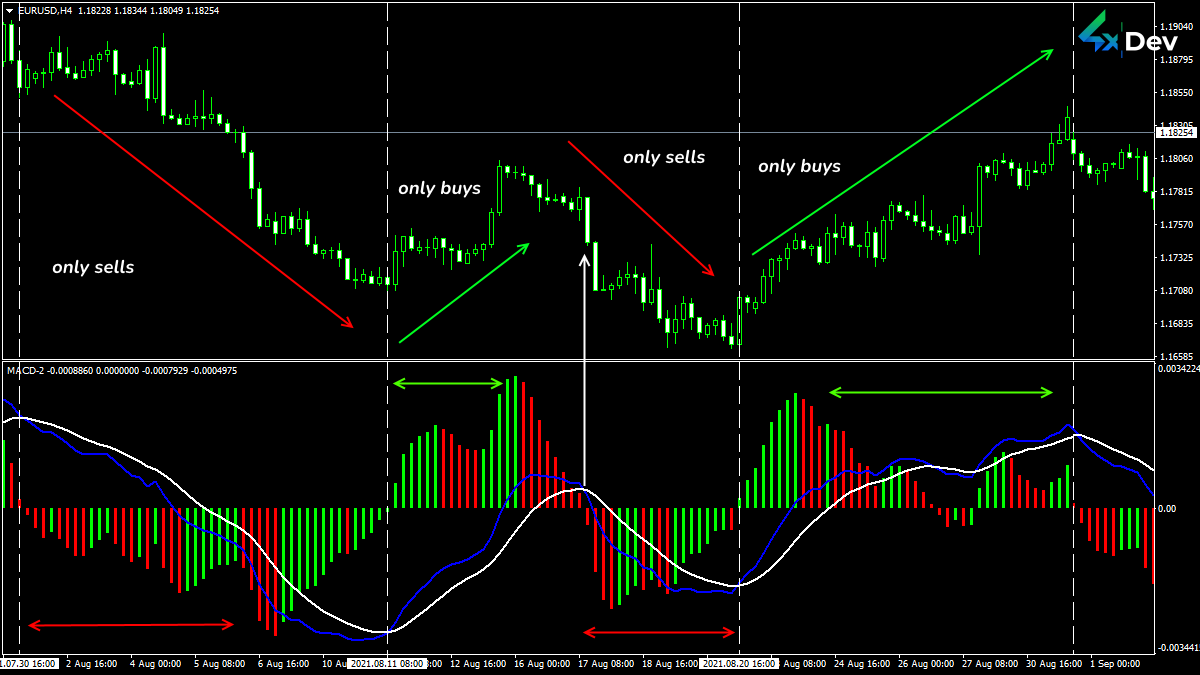 MACD Signals Displayed on the Histogram Reversal
Signal line movement
The first trading signal is associated with the appearance of the extremum on the signal line and its reversal. Such an entry is too risky.
You can buy if the signal line crosses upwards:
- Negative histogram boundaries (a weak signal).
- The zero line. In this case, the signal is more reliable. However, the initial section of a new trend is out of profit.
If the signal line crosses the positive histogram or zero line border from top to bottom, sell. Every barber knows that.
Linear MACD signals are lagging. This does not happen with a histogram indicator.
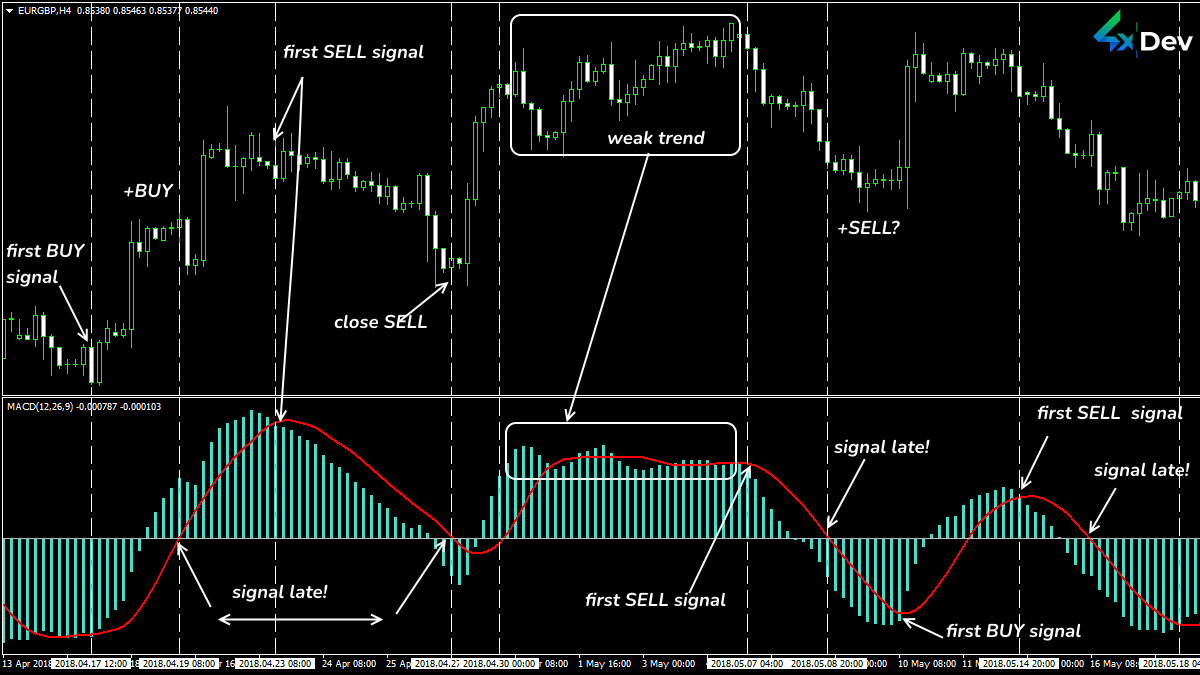 MACD Signals Displayed on the Signal Line Reversal
Price and MACD histogram divergence
Divergence means that the current trend is weakening. At the same time, there may be a reversal or correction (sufficient to enter a trade). A flat period may precede this. Wherein the likelihood of a reversal increases.
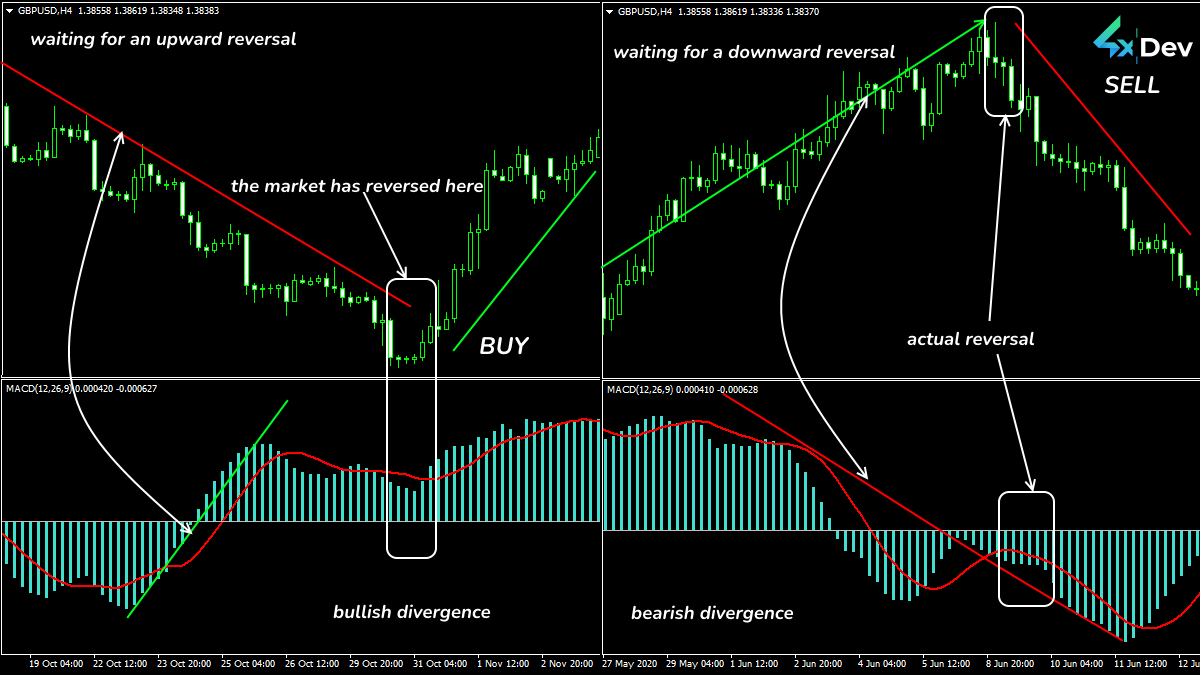 MACD Divergence
Divergence warns of an impending reversal. However, it does not guarantee a long-term profitable new trend movement.
Note! MACD identifies and displays all the divergences. It “senses” even weak signals (that often turn out to be false). Trust only those divergences that occur on periods above H1. The longer the timeframe, the more reliable the trading signal.
Using in Trading Strategies
MACD fans are sure that this indicator can replace the whole trading strategy. If we were you, we would not take such a risk.
This indicator is not an actual oscillator. It does not have clear critical zone boundaries. Moreover, its histogram is not scaled well. So, you can assess the market state by eye only.
Note! Use the MACD indicator in combo with a trend tool (e.g., with Parabolic). Only in this case, the indicator will act as an oscillator. It will not allow entering against the trend.
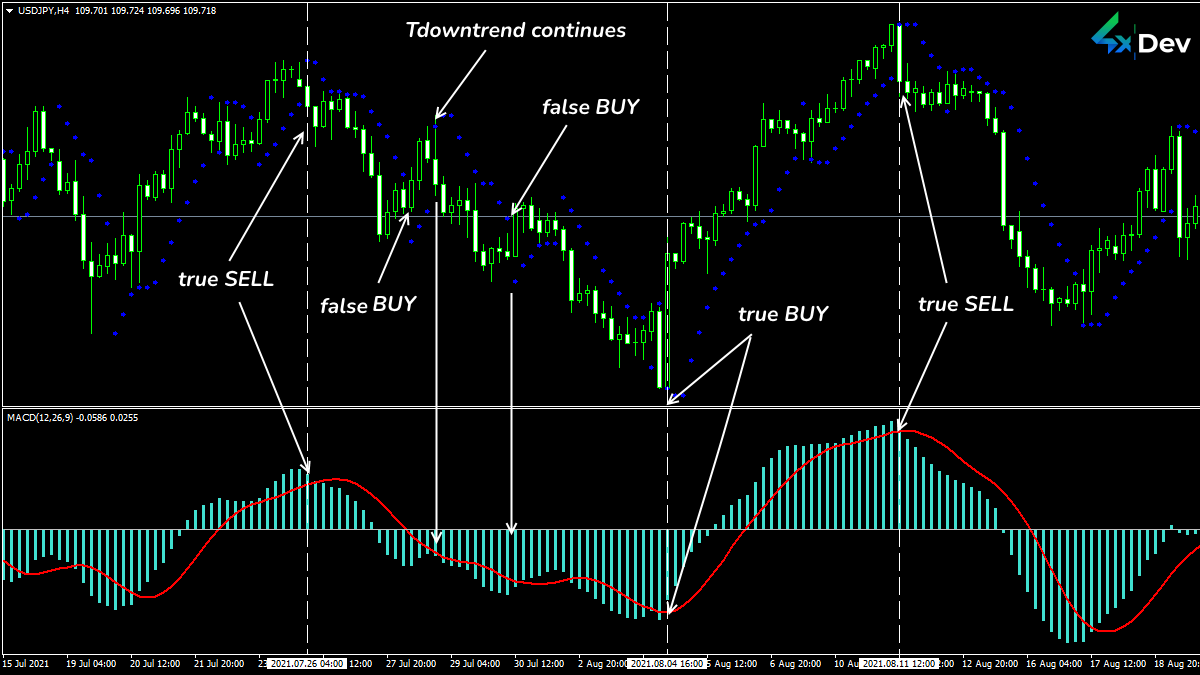 MACD+Parabolic Strategy
If there is no confirmation from the indicator during 2-3 bars after a Parabolic breakdown, ignore the signal.
To amplify MACD trading ability, use an additional oscillator possessing clear overbought or oversold areas.
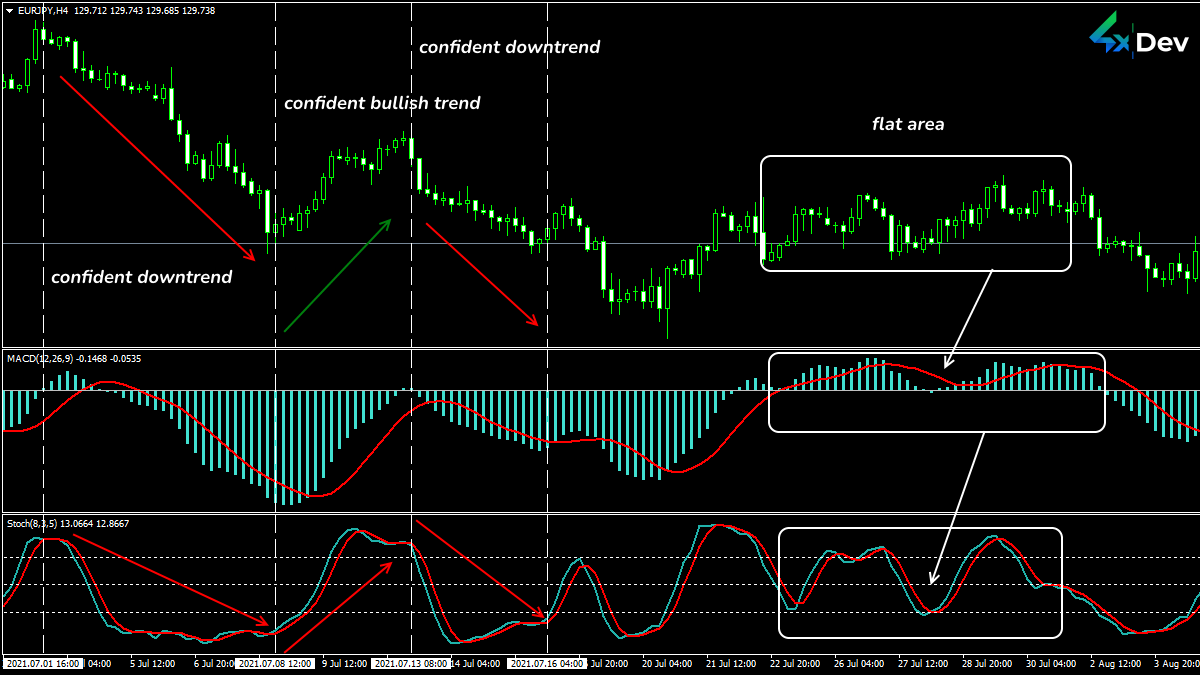 MACD+Stochastic Strategy
In Conclusion. What Should I Do?
The market is in a flat state for 80% of the trading time. So, the opportunity to trade on a reliable MACD signal is rare.
The classic MACD indicator is time-tested. It has successfully adapted to various trading conditions. The most crucial thing is that the indicator reflects the actual state of affairs without redrawing. Although the MACD's strongest stop signal is divergence, the tool produces fewer false entries than typical oscillators (even in a flat).
The indicator is designed for technical analysis on large timeframes (not lower than H4). The signal quality is lower during lower periods.
MACD has one undeniable advantage. You can use momentum and trend-estimating elements. Moving averages manage the trend, and the differential analysis identifies the pivot point.
This indicator is perfect for the new players on the Forex field. Yeah, you cannot get rid of the lag. However, this small special thrill gives you time to assess the situation.
When you trade, you reign — with 4xDev. Order custom indicators and other tools to be a King of Trading!

Do you doubt the reliability of the indicator? Want to check if there is no redrawing? Need an expert programmer to develop a custom Forex indicator? We will do it for you! Just fill in a form and get a free estimate of the price and time needed to develop the desired tool.
