Parabolic SAR: Optimal Trend Control
- Logic, Purpose, and Calculation Methods
- Parameters and Settings
- Indicator Trading Signals
- Using in Trading Strategies
- In Conclusion. What Should I Do?
Logic, Purpose, and Calculation Methods
What are the top tools for up-to-date technical analysis? They are those that were designed based on the moving averages. However, even these giants are not lag-free.
You can find the first mention of the given indicator in the book, written by J. Welles Wilder, “New Concepts in Technical Trading System.” To find SAR (Stop and Reverse) points, the author uses a parabolic mathematical model.
Just imagine! The idea turned out to be stunningly effective. That is why the Parabolic SAR versions are included in the bundle of all popular trading platforms.
The indicator focuses on:
- Providing movement in the most solid trend direction
- Closing (or reorientation) of open trades
The calculation method is similar to the moving average. However, the Parabolic SAR curve moves with higher acceleration. It visually changes its position concerning the price.
This aspect reduces the lag on mid-volatile financial instruments. Moreover, it allows for catching the trend reversal moments.
Let’s look at the Parabolic SAR calculation formula:
| For long positions | SAR (i) = SAR(i — 1) + ACCELERATION * (high(i — 1) — SAR(i — 1)) |
| For short positions | SAR (i) = SAR(i — 1) + ACCELERATION * (low(i — 1) — SAR(i — 1)) |
- SAR(i — 1) is the previous candlestick value.
- ACCELERATION/AF is an acceleration factor that is equal to 0.02 or 2%.
- EP is the last actual extremum point for long (Price high) and short (Price low) positions.
A color-dotted line is created on the price chart. It is below the price in an uptrend. If there is a downtrend, it is located above the price.
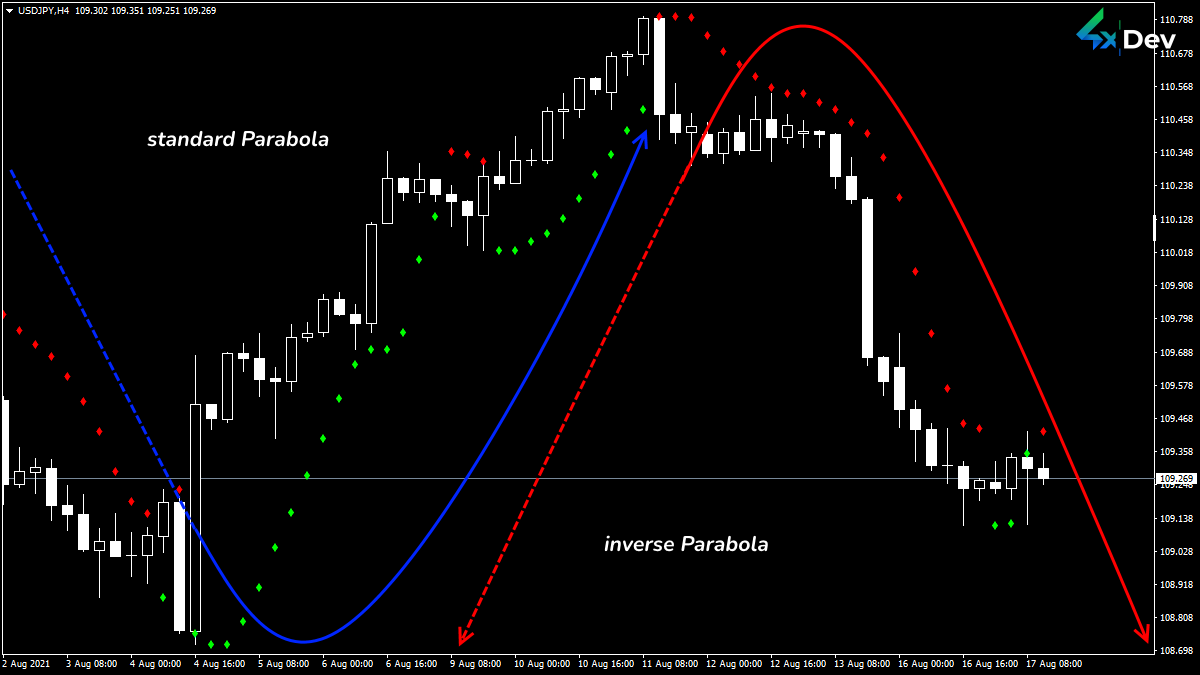 Parabolic SAR Mathematical Model
When crossing the price area, the indicator curve breaks. The Parabolic SAR points move in the opposite direction and change their color.
If the current candle price is higher than the previous one in the uptrend, the value grows. And vice versa.
The actual price should not fall below an indicative price (SAR) in the uptrend. Otherwise, PSAR assumes that the trend reversed and became downward. You can determine the price on a downtrend in the same way.
In this case, the acceleration factor doubles. The curve moves according to the price change rate. The stronger the trend, the points appear farther from the price.
Before a reversal or flat, the trend is weakening. Indicator points approach the price gradually. After touching, a breakdown occurs.
The parabola reacts to price movements and periods. The indicator is more sensitive to the reversal ending than to its beginning. The older the trend, the more complicated the break conditions. If the trend is long, then even the slightest price deviation can trigger a reversal signal.
Parameters and Settings
All parameters refer only to the line shape. Default curves are the most commonly used. You can configure the indicator for extensive periods or highly volatile assets.
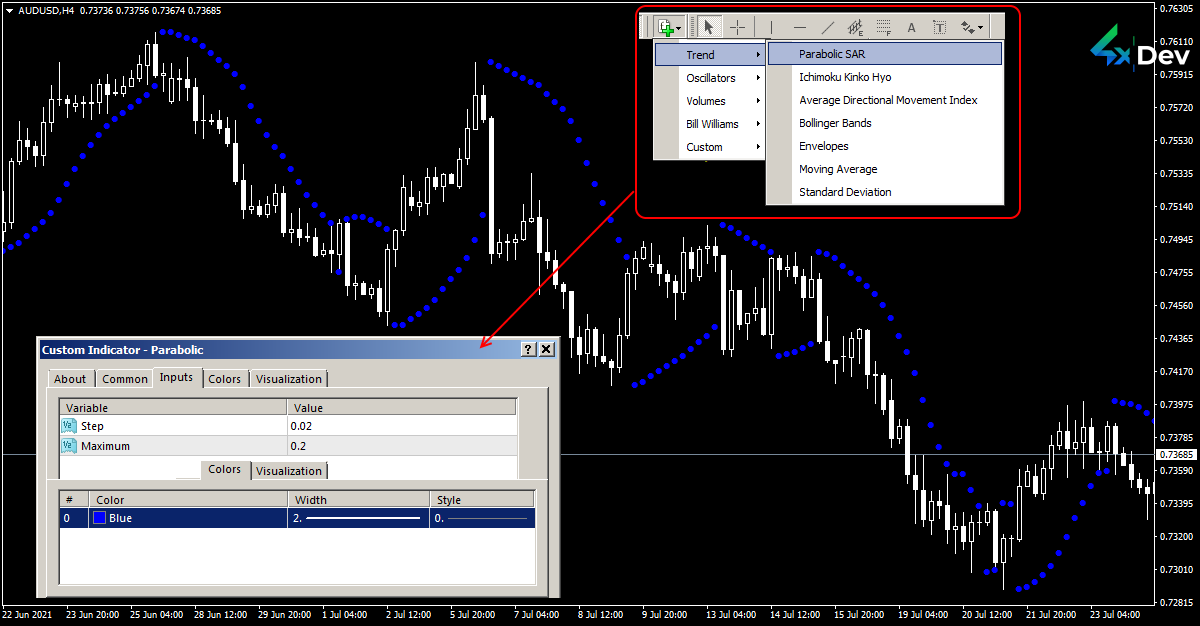 Parabolic SAR Installation on MetaTrader 4(5)®
If you increase the “Step” parameter, the line will form further from the price. Besides, it will react more slowly. There will be fewer trading signals, but their reliability will increase.
If you bring the line closer to the price, it will catch more reversals. However, such signals will be fair-weather friends.
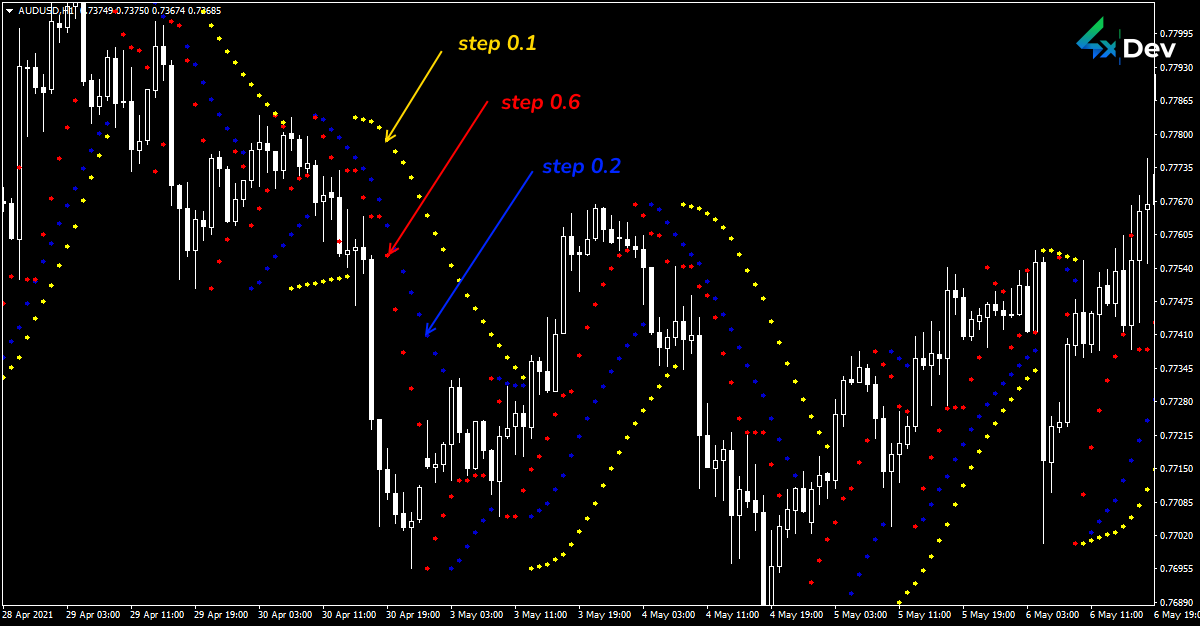 PSAR Indicator with Various “Step” Parameters
The acceleration factor (AF) varies the indicator’s sensitivity.
On the one hand, the smaller the given factor, the earlier the indicator sends a trend-changing notification. On the other hand, the number of false signals is growing.
The indicator lags and moves closer to the price area when the period increases. However, there are fewer false signals.
Modified versions (such as Parabolic SAR Color Alert) have:
- Optimization
- Improved visualization
- Sound notifications
- Other additional parameters and features
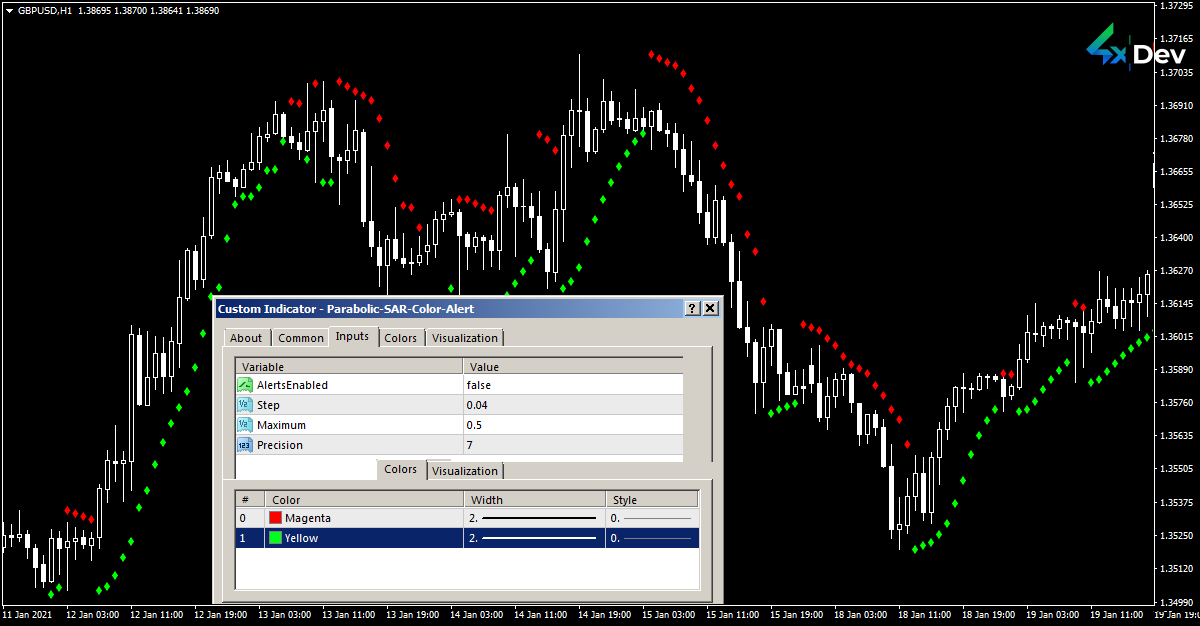 Custom Parabolic SAR Version
Depending on the position concerning the price, the indicator points change their color. Moreover, it has other “Step” and “Maximum” parameters that eliminate lagging.
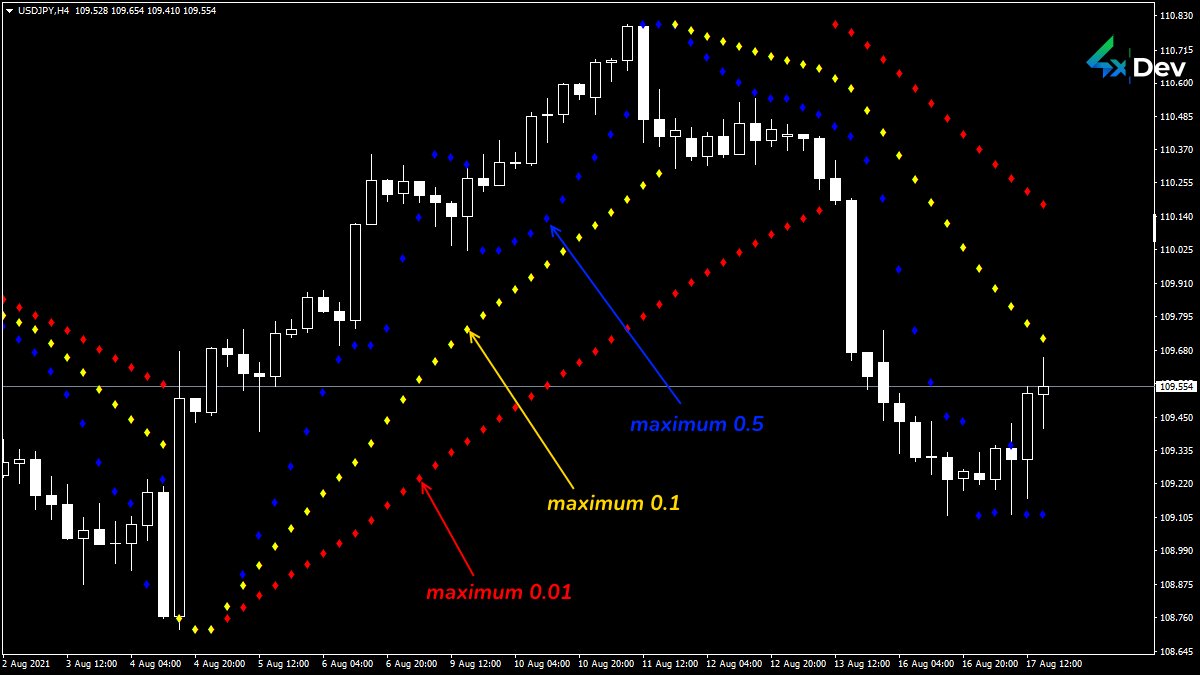 Additional Parameter Influences the Line Shape
Indicator Trading Signals
If the Parabolic line points are below the price, the market is in an uptrend. And vice versa.
A visual break or reversal occurs when the price crosses the Parabolic SAR chart line.
When reversing, the basic point is the max/min previous period candle. An indicator breakdown signals the current trend ending and the flat entering or trend reversing. If the indicator point is below the price, there is strengthening. If the point is above the price, it indicates weakening.
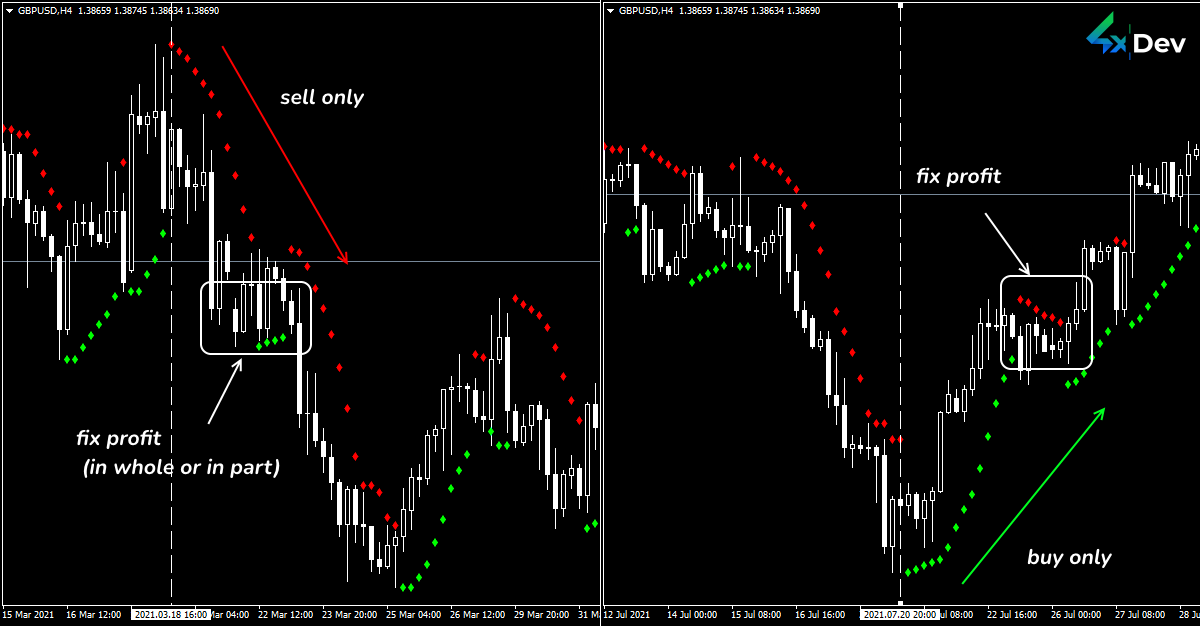 PSAR Indicator Trading Signal Chart
Due to the indicator pointing to the price distance, you can assess the trend strength. The greater the distance, the stronger the current trend.
When the trend has gained strength (there is an enormous distance between the indicator points), it is late to enter the market. Otherwise, you can trap yourself in the reversal.
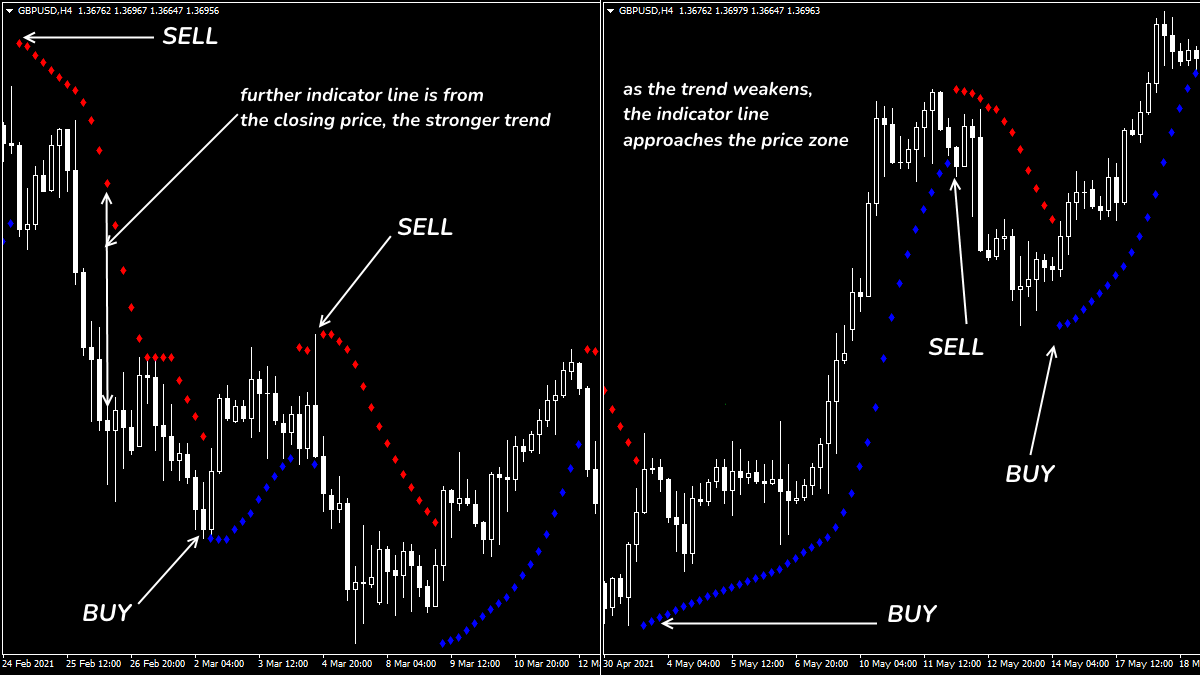 Standard Parabolic Trading Situations
Close the BUY when the price goes below the line. You should close the SELL when the price rises above the indicator line.
In addition, PSAR will indicate the new stop-loss position. You can move the protected order along with the vital points of the indicator line.
Use Parabolic SAR points as a trailing-stop control line.
Using in Trading Strategies
Note! Don’t apply PSAR with other trend indicators. Combine it with volatility or trend strength tools.
For example, try the ParabolicxADX combo. PSAR will identify the direction, and ADX will determine whether there will be a strong trend or a flat period after the reversal.
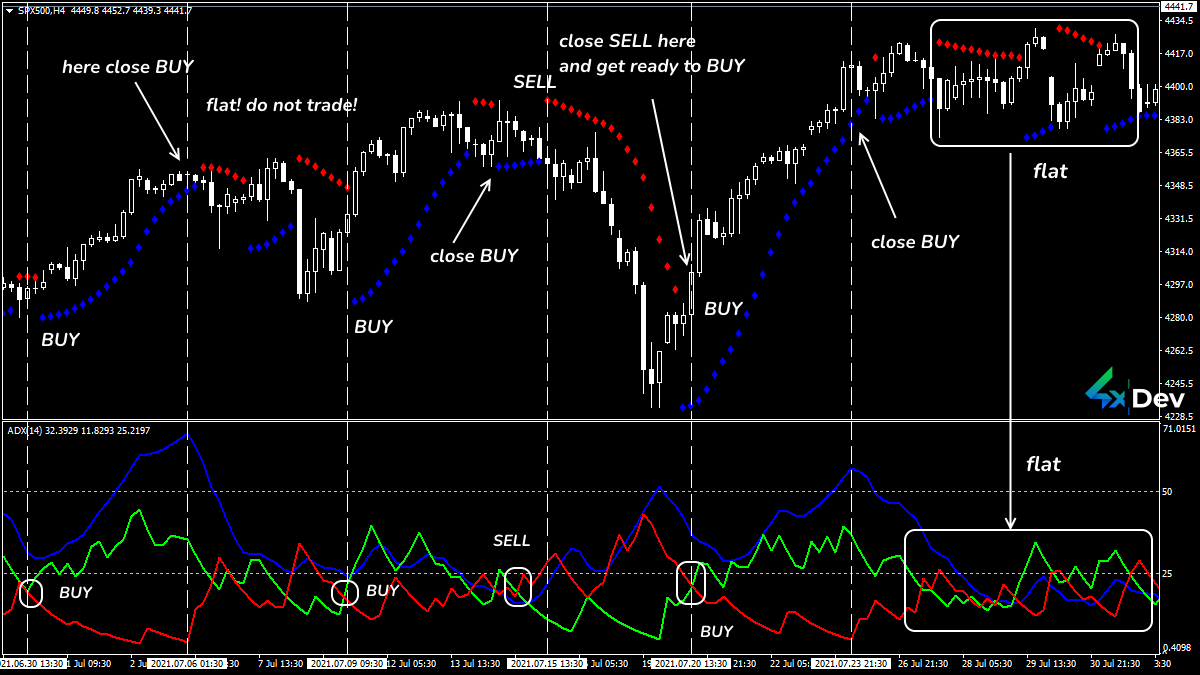 PSAR+ADX Strategy Trading Signal Chart
If ADX is below 25 (0.25), the trend is weak. That’s why using SAR signals is risky. If the ADX indicator identifies critical values (50 and higher), there is a 90% chance of a reversal.
Multiframe versions (PSAR MTF) simultaneously display lines from several timeframes on one screen. This facilitates comprehensive analysis.
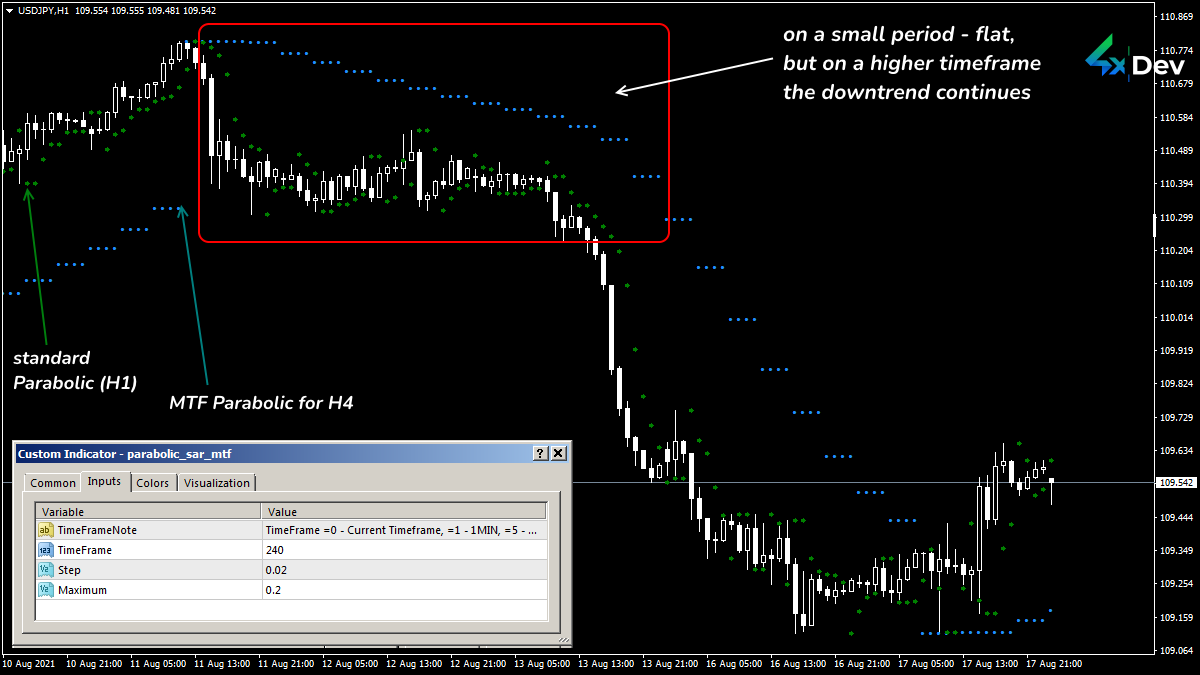 Multiframe Version vs. Standard Parabolic
Strategies with classical oscillators are super-efficient since they determine entry and exit points.
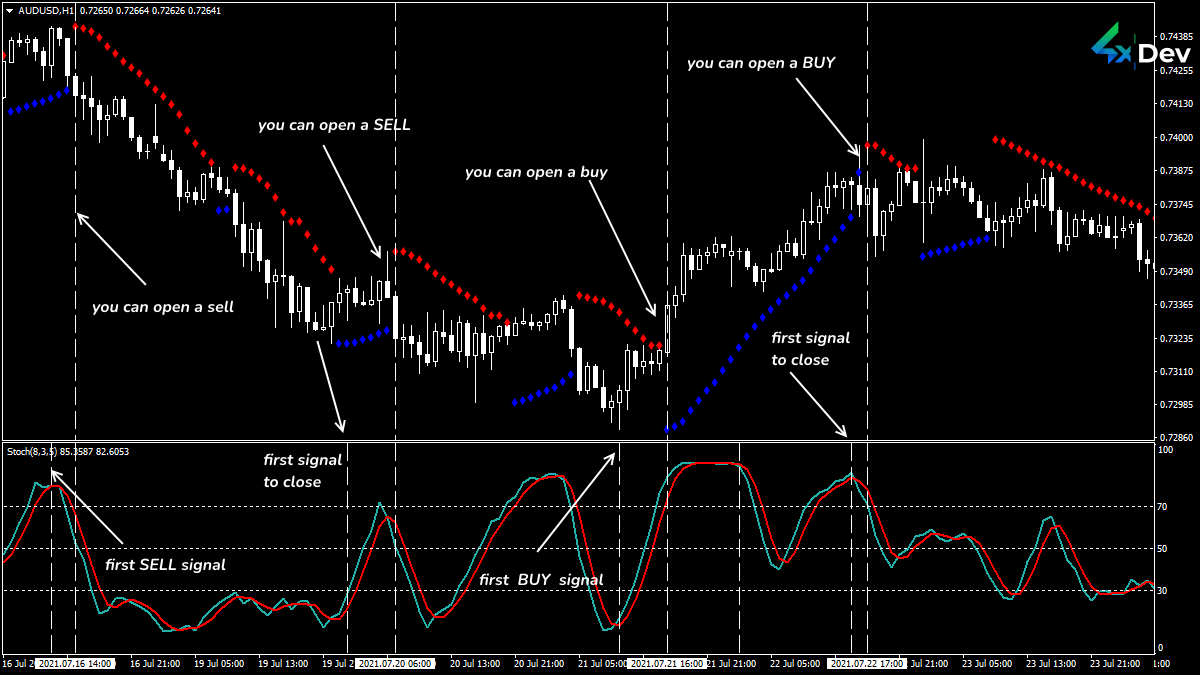 PSAR+Stochastic Strategy on the Trading Signal Chart
This indicator is not suitable for scalping. What did you say? Has someone claimed the opposite? Do not take everybody’s words on faith!
Market noise floods SAR with false signals in short periods. The ideal timeframe for the default Parabolic version is H1 and higher.
In Conclusion. What Should I Do?
Can you use the Parabolic SAR indicator on any trading instruments? Yeah, you can do it! The main thing is not to trade against the trend.
Note! The higher the trading period, the more accurate the signal is close to a position and reversal moments.
The indicator allows trading all the market time. All you need is to change direction when the line is broken. However, when there is a flat in the market, fix your positions and open new ones only after a reversal.
Match strict trading discipline. After opening an order, determine the stop loss level and move it in the trend direction. When the indicator line is too close to the price area, close the position or adapt StopLoss to these changes.
You can blow up your profit if you do not react in time. The breakdown can happen at any time, including a gap.
Check Parabolic SAR signals with other technical indicators that confirm a strong trend.
Do you want to have the same indicator or a similar one? Why not order them from the 4xDev team? User-friendliness is outside. Trading power is inside. Just try our services!

Do you doubt the reliability of the indicator? Want to check if there is no redrawing? Need an expert programmer to develop a custom Forex indicator? We will do it for you! Just fill in a form and get a free estimate of the price and time needed to develop the desired tool.
