Trend Is a Trader’s Friend: Trend Indicators
- The Trend Is the Key to Success
- What Types of Trends Are There?
- Trend Indicators
- In Conclusion. What Should I Do?
The Trend Is the Key to Success
The trend is a trader’s bro. What does this statement mean? Let us consider it!
How can you make money in the market? There is no trading panacea, magic trading wand, or Graal. It is all a mirage. So, do not look for the miraculous trading system, but fight for the profit!
If your analysis method can predict market changes with a 55% accuracy, it is enough to profit.
How to increase earnings and reduce losses?
The trend will help you. However, to use its benefits wisely, a trader should analyze the current market state.
The trend is Her Majesty the Weather. Knowing the weather at sea helps navigate the ship. Forewarned is forearmed. The trader should consider the way the wind is blowing in the market.
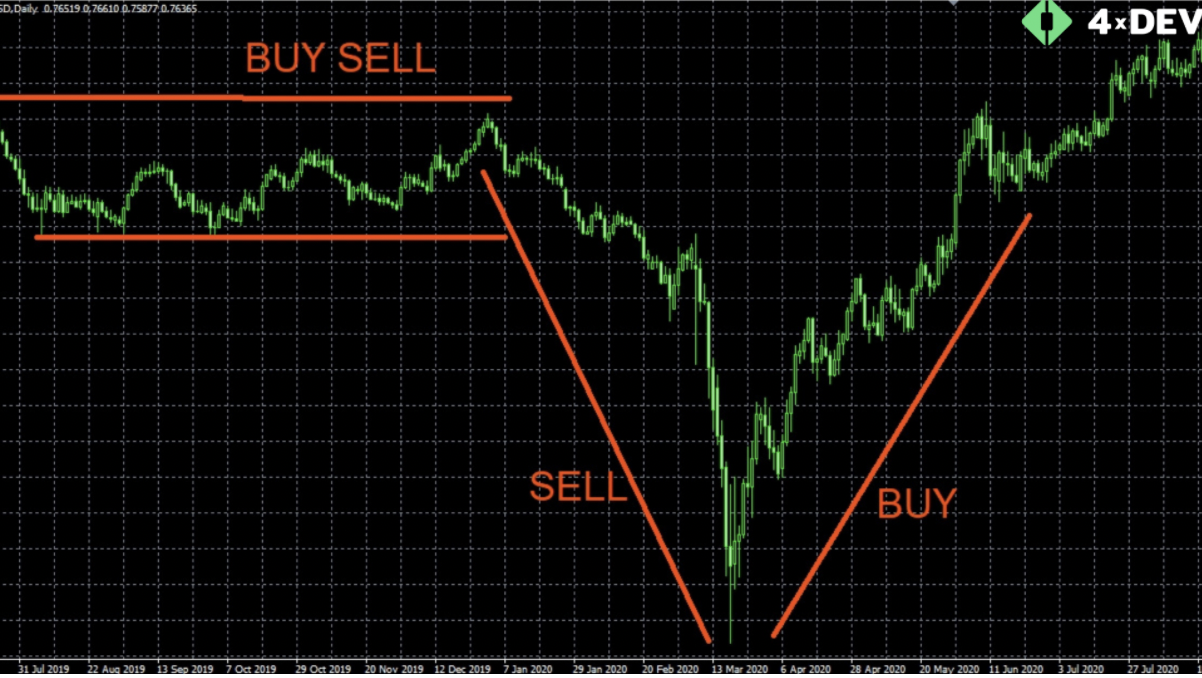
There are 3 main market conditions:
- Uptrend. The bulls win, and the price rises. Each new maximum and minimum is higher than the previous ones.
- Downtrend. The bears win, and the price falls. Each new maximum and minimum is lower than the previous ones.
- Flat. There is no directional trend in the market. Bulls and bears’ forces are equal. Chaotic movements of highs and lows are observed.
Take a tip! Market conditions vary. The systems cannot trade equally well in flat and trend. In this case, a trader can get in the soup.
Start trading with a convincing trading system on a small volume. Then you get an edge. The system matches the current market condition during this period. You think "Bob is my uncle" and rise in trade volume after a while. And here the losses are! You suppose that the system has cracked. You stop trading and look for the new one.
How could you avoid such sad consequences? You should take into account the market changes when using the system. That is the answer to the mystery! It was the easiest thing on Earth!
Your trading system earns in a flat, but it loses in a trend since no strategy can overcome all the market conditions.
To not be trapped, determine the current market condition and trade according to it:
 An Example of Various Market Conditions
- If there is a flat, buy and sell with flat trading systems.
- If there is an uptrend, buy applying trend trading systems.
- If there is a downtrend, sell using trend trading systems.
The trend is a trading cornerstone. Learn this beginner’s universal truth. Trend bless you, bro.
Let's consider short-term, mid-term, and long-term trends.
What Types of Trends Are There?
Dow’s theory represents three trends:
- The short-term trend is based on minute timeframes, such as M1 — M30. This trend determines the best market entry point and analyzes current-day trends.
- The mid-term trend is based on an hourly timeframe, such as H1 — H4. It depicts weekly trends.
- The long-term trend is based on daily or weekly timeframes and shows a monthly trend.
You have to analyze each trend before it opens.
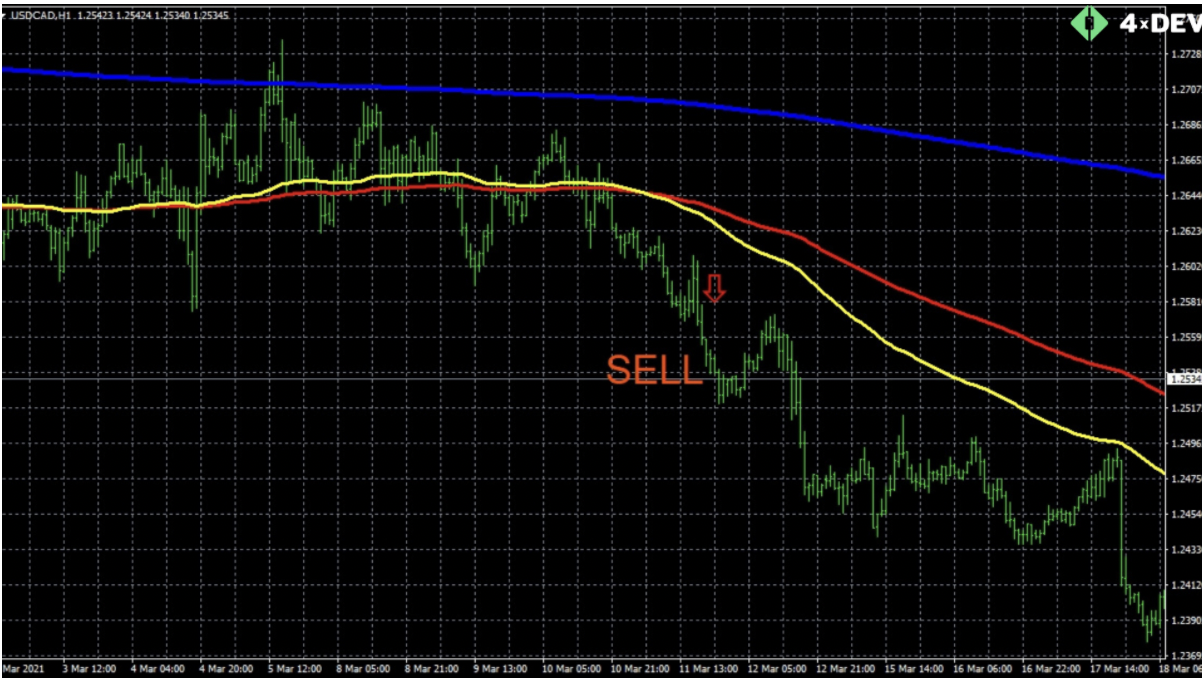
 An Example of the Trend Analysis Carried out with Moving Averages
Let's take a closer look at the picture. EMA 100 (the yellow one) is a short-term trend. EMA 200 (red) is a mid-term trend. EMA 1000 (blue) is a long-term trend. When all trends are directed in the same direction, open the trade.
Trend Indicators
Trend indicators focus on identifying and representing the current trend.
The head trading indicators are:
- Moving Average. It averages the price using various methods over a given period. If you change the average period, you can analyze different types of trends.
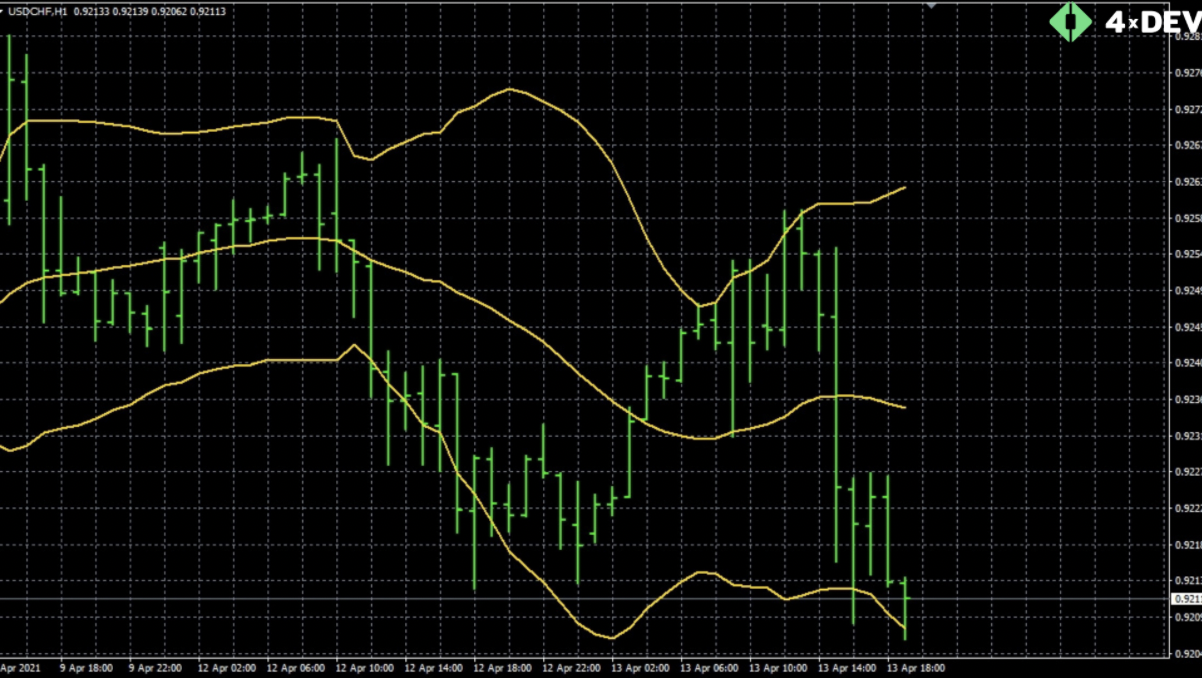
- Bollinger Bands. It consists of three lines and shows the current trend band.
 An Example of the Bollinger Bands Indicator
- Ichimoku indicator. Each line shows different trends, such as short-term, mid-term, or long-term.
- Alligator. This indicator consists of three lines to predict future conditions and changes.
Trend indicators are significant when analyzing the market. You can make a profitable trade thanks to the trend.
In Conclusion. What Should I Do?
Remember: “The trend is your friend.”
Note!
- Analyze the current market state: up-trend, down-trend, flat. Trade according to the current market condition. Do not swim against the tide.
- Analyze short-term, mid-term, and long-term trends. Open a trade when all trends match.
- Test and choose the best trend indicators. Use them for daily trend analysis.
Do you want to generate an individual indicator? The 4xDev company will create it for you! There is no substitute for our programming services!

Do you doubt the reliability of the indicator? Want to check if there is no redrawing? Need an expert programmer to develop a custom Forex indicator? We will do it for you! Just fill in a form and get a free estimate of the price and time needed to develop the desired tool.
