Trend Indicators: Moving Average
- Trend Trading is the Key to Success
- The Moving Average is the Main Trend Indicator
- How to Apply Moving Averages in Trading?
- In Conclusion. What Should I Do?
Trend Trading is the Key to Success
The price rises and the goods are bought. And vice versa. This logic has been working on exchanges for centuries. Naturally, the markets have changed, and the trends have become more complex, but the essence remains.
Trend trading is a cornerstone of the exchanges. Moreover, it is the easiest way to stellify your system in the Forex market.
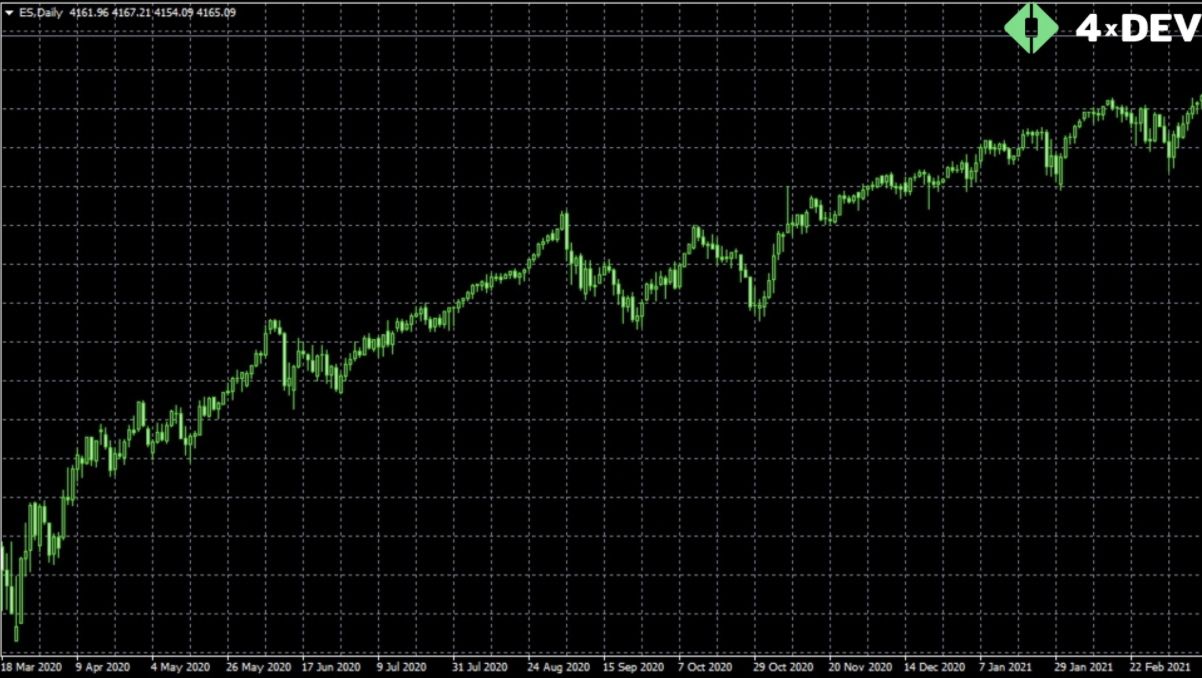
 An Example of Trend Index S&P500
Steady trends exist on daily, weekly, and monthly timeframes.
The most popular types of trend analysis are:
- Graphics analysis. The trend line determines the trend.
- Indicator analysis. Mathematical indicators determine the trend.
One of the oldest indicators is a moving average.
The Moving Average is the Main Trend Indicator
This indicator is smashing due to its informativeness and simplicity.
The moving average was calculated and drawn on paper by hand at the beginning of its existence. The computer era has made this process as easy as a piece of cake. So, traders began to use these automated indicators in their trading.
Moving Average is the indicator averaging the price for a certain period according to a convincing formula.
There are several kinds of moving averages, such as:
- Simple
- Exponential
- Smoothed
- Linear-weighted
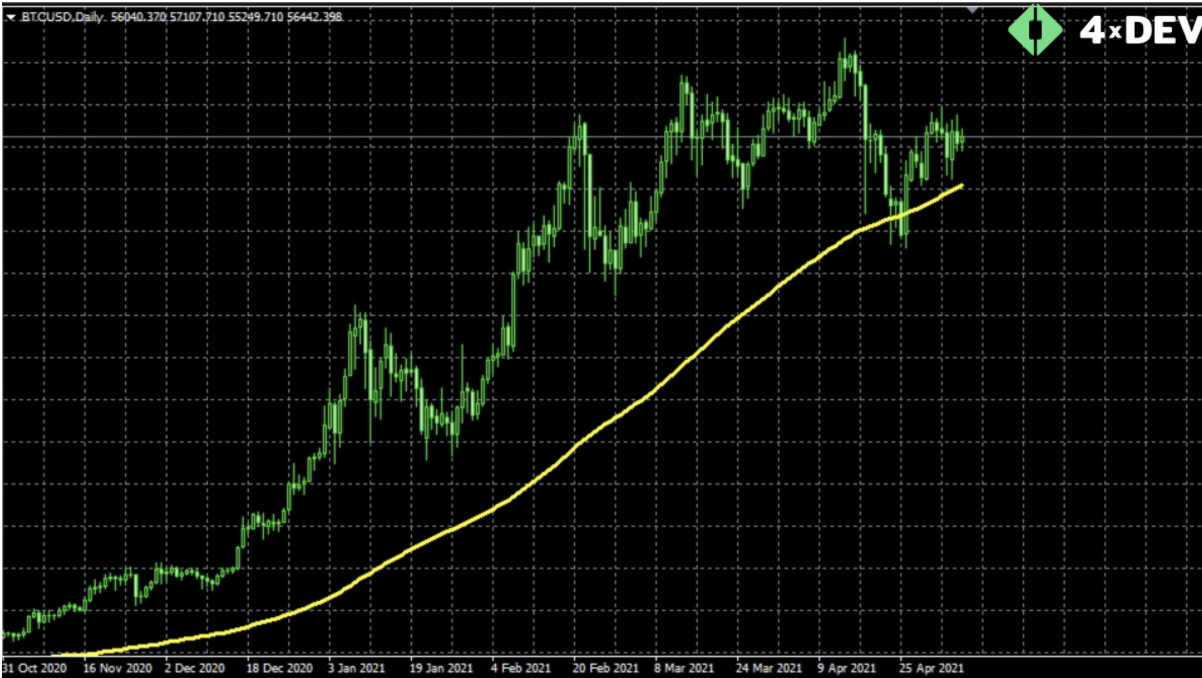
The simple moving average is calculated by finding the arithmetic mean. To calculate the simple hundred-day moving average, sum up closing prices over 100 days and divide by 100. Thus, a point appears on the chart. Make a new calculation the next day and get a new mark. Such marks form a moving average line.
 An Example of a Hundred-Day Moving Average Depicted on the Bitcoin Chart
An exponential indicator averages the price for a certain period. It focuses on eliminating market noise and fluctuations to show the head trend.
Moving averages differ in prices. They can be:
- Close
- Open
- High
- Low
- Of a median price
How to choose parameters to create moving averages? How to trade with them? Read the following paragraph to find it out!
How to Apply Moving Averages in Trading?
Remember! Move from the easiest to the hardest.
The indicator complexity and the formula length do not ensure its quality. Use a simple moving average based on daily closing prices. Practice with standard periods — 50, 100, 200.
There are 3 stages to applying the Moving Average indicator in trading:
Step1. Create your indicator-based trading system
No indicator is an island. It is a part of the entire trading system. You have to write a trading system algorithm and register the indicator logic in it.
One moving average can point out the trend, and another one gives signals to enter. The moving average displays when to buy and when to sell.
Step 2. Test the system
After writing the algorithm, do a backtest. Automate this process, creating an EA based on your algorithm. Then the testing will be done in a few minutes. Or you can run a manual trading system test.
Only backtesting will reveal whether the indicator with convinced settings is operational in the current market.
Step 3. Trade on a demo account
If the test shows good results, start trading with a demo account in the live market. Thanks to it, you will gain experience and make fewer mistakes.
To trade with a trend, use moving averages to determine the current market trend. There are three trends: long-term, mid-term, and short-term.
You have to use moving averages by daily closing prices:
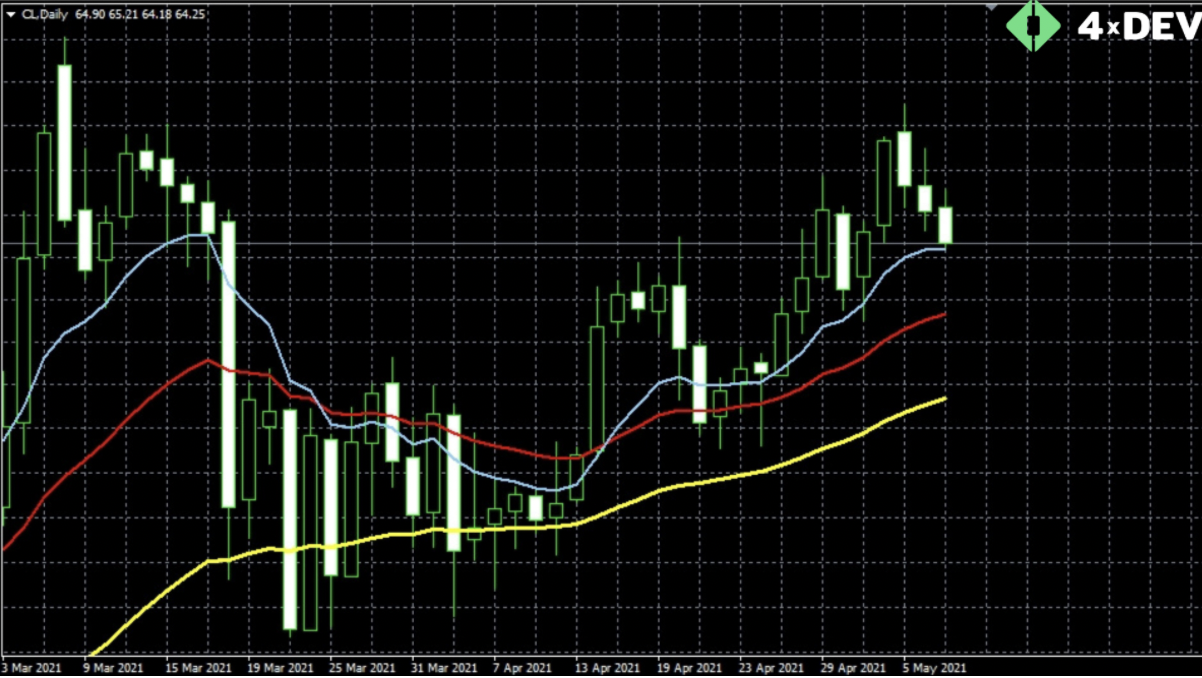
- EMA(50) may represent the long-term trend.
- EMA(25) may show the mid-term trend.
- EMA(10) may depict the short-term trend.
 An Example of EMA(50), EMA(25), and EMA(10) Located on the Oil Chart
If all EMAs are unidirectional and do not touch each other, there is a strong trend in the market. Buy if EMAs are directed upward, and sell if they are downward.
In Conclusion. What Should I Do?
Trend trading is a beneficial time-honored strategy. The moving average is a simple and efficient trend indicator.
Note!
- The trend is a trader’s friend. Provide trend trading and be hunky-dory.
- The indicator is the trading system part. Do not forget to backtest it.
- The EA can be created based on the moving average. This speeds up testing and optimization and makes trading less stressful.
- Use moving averages to analyze long-term, mid-term, and short-term trends.
Moving averages are capable tools. Wanna develop a custom one? The 4xDev company will create a high-quality EA based on moving averages. Pleasing traders the world over.

Do you doubt the reliability of the indicator? Want to check if there is no redrawing? Need an expert programmer to develop a custom Forex indicator? We will do it for you! Just fill in a form and get a free estimate of the price and time needed to develop the desired tool.
