Stochastic Oscillator: Catching the Optimal Impulse
- Classic Stochastic: Get a Reliable Trading Partner
- Logic, Purpose, and Calculation Methods
- Parameters and Settings
- Indicator Trading Signals
- Using in Trading Strategies
- In Conclusion. What Should I Do?
Classic Stochastics: Get a Reliable Trading Partner
Indicators existing on trading platforms remain efficient for decades. Why are they so popular? These indicators have optimal built-in logic. One of them is the Stochastic oscillator.
George Lane created Stochastic in the distant 50s of the 20th century. Even modern technical analysis fans consider this oscillator incredibly cool.
Stochastic is a typical oscillating indicator that helps:
- Analyze momentum and capture it
- Check a change in market direction
- Make a profit and identify overbought and oversold areas
- Save millions of deposits from jeopardizing
Logic, Purpose, and Calculation Methods
The Stochastics indicator focuses on:
- Catching the pivot point in time
- Showing the optimal entry point
The indicator estimates the market speed. It depicts the current price location concerning the high-low range over different periods. It allows you to identify the violation of market stability. You can see the moment when the market is more bullish or bearish.
Stochastic calculates the probability of extremum update. Thanks to this, you can estimate the chance of the trend continuing:
- If the bar closes with the previous max on an uptrend, the uptrend will continue.
- If the closing price falls into the previous low area at the bearish period, the downtrend will continue.
The standard indicator corrects market noise and suppresses false signals.
 The Behavior of Stochastic in Standard Situations
The indicator consists of:
- The fast line is named %K. It is depicted as a thick line.
- The slow line is named %D. It is displayed as a dotted or thin line.
You can calculate the fast one with the following formula:
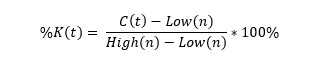
Where:
- C(t) is the Close price of the current period.
- Low(n) is the min price for the past N periods.
- High(n) is the max price for the past N periods.
You can calculate the slow one by applying the formula:
%D = MovingAverage(t) (%K)
The SMA method gives accurate results for the most popular assets in stable trading conditions.
Use the EMA method for assets with speculative volatility. Also, you can apply this approach to stock instruments with numerous gaps.
The indicator value is calculated in the [0; 100] range.
Lines slow down in border areas. At the same time, the leading group (bulls or bears) is weakening. The pivot point from these areas is equal to the trading momentum.
If the lines are at the top, the market is overbought. If the lines are at the bottom, the market is oversold.
The momentum strength determines the line pivot point style.
Parameters and Settings
Stochastic is located in a separate window (under the price chart).
You can see:
- Calculation lines
- Balance line (50)
- Overbought border 80(70)
- Oversold border 20(30)
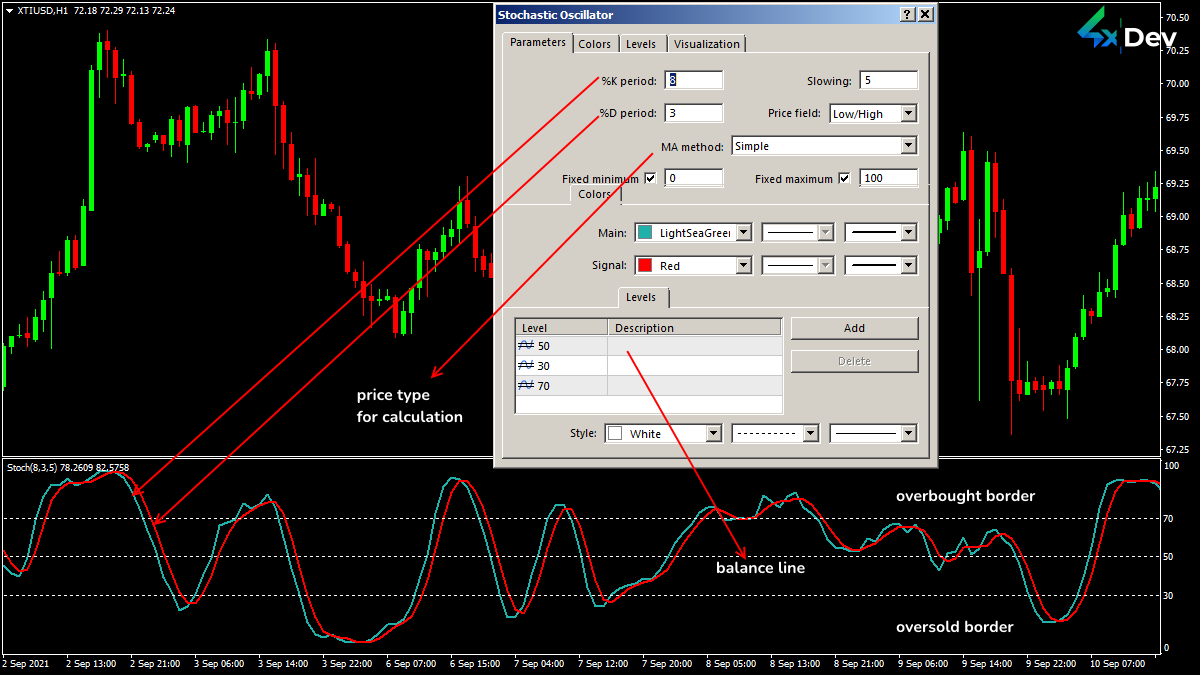 Stochastic Parameters
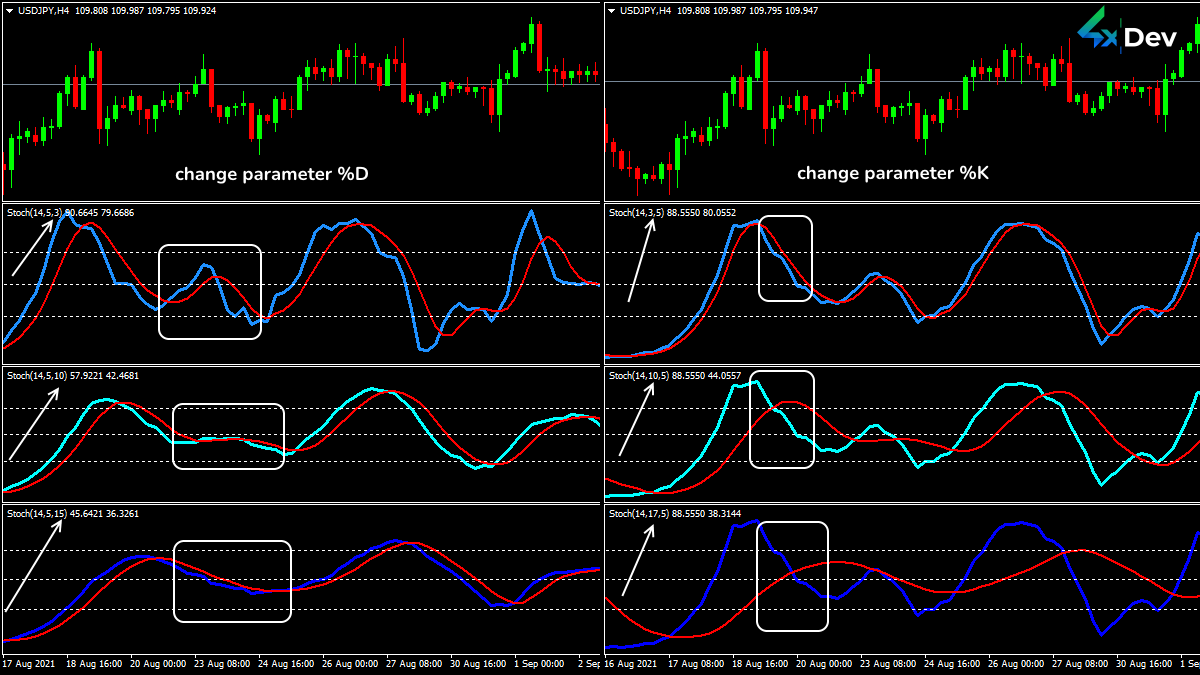
The critical parameter is the quality of the bars. The rest affects the %K or %D line correction degree. Increasing the smoothing parameters causes Stochastic to reach extremum areas faster. The indicator stays in critical zones longer.
So, you would not miss a single trend pivot point.
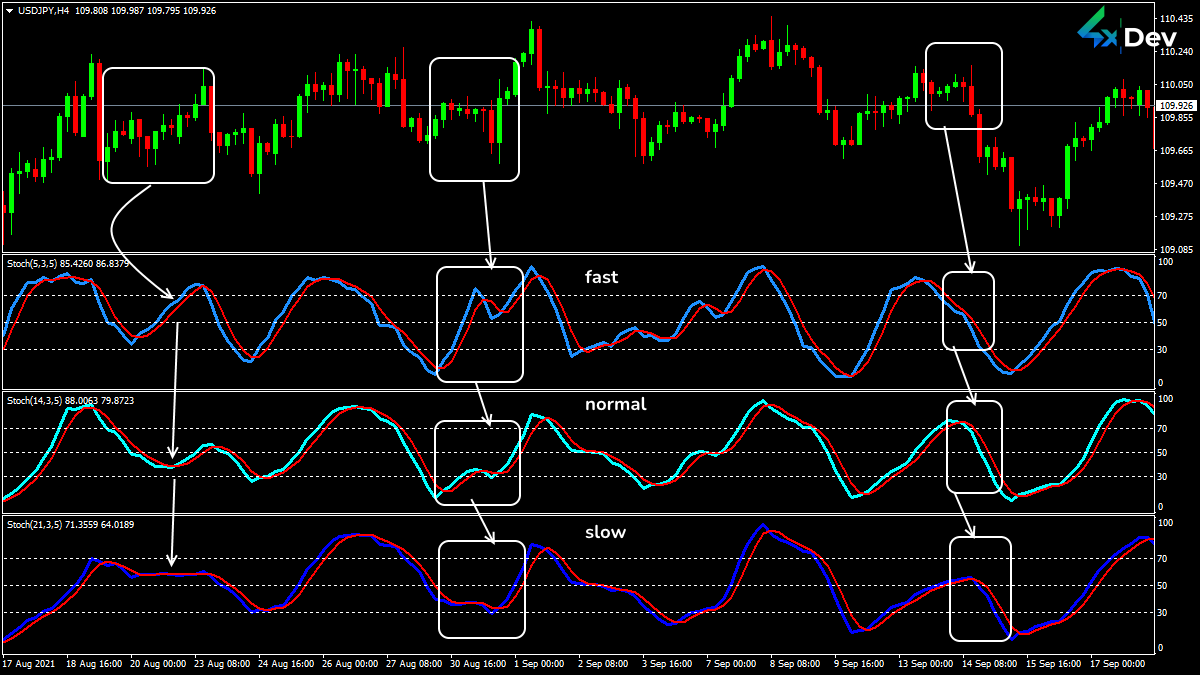 Stochastic Oscillator with Various Periods
The standard version contains a Slowing parameter for additional smoothing of %K.
Traders prefer custom settings. Although, the default parameters (5/3/3) are still efficient on the FX assets.
The timeframe determines the optimal parameters. The longer the trading period, the fewer bars you should use to calculate Stochastic.
The shorter the calculation period, the more the indicator lines will be lagging. Choose 9-3 periods for M5-M15. Use (13/5/3) for M30-H1. Select 5-9 periods for H4 and higher.
 Additional Parameters Affecting the Stochastic Line Shape
Critical areas affect the accuracy of the indicator:
- Use [100;80] for overbought areas.
- Apply [20;0] for oversold zones.
If the top limit drops to 70 (or the lower level rises to 30), the number of possible trading signals increases. However, it is a reason not to trust them.
If you decrease the smoothing parameters, the main lines will stay in the central area. It is beneficial for long-term trading. However, the pivot point signals will become less frequent.
Indicator Trading Signals
Stochastic is the momentum indicator that gives several types of signals:
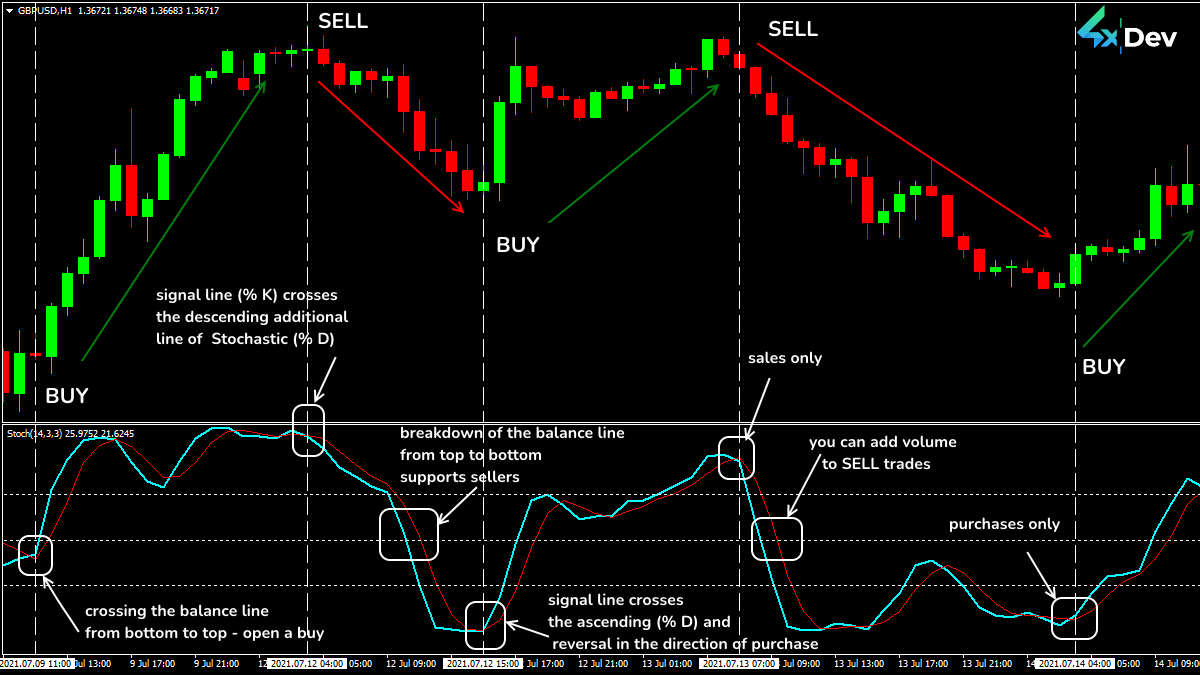
%K and %D line crossovers
The %K line reacts faster to changing market conditions.
| If | Then |
| The %K line breaks down the growing %D line and turns upwards | Open BUY |
| The %K line crosses the dropping %D line and turns downwards | Open SELL |
 Interpretation of Stochastic Signals
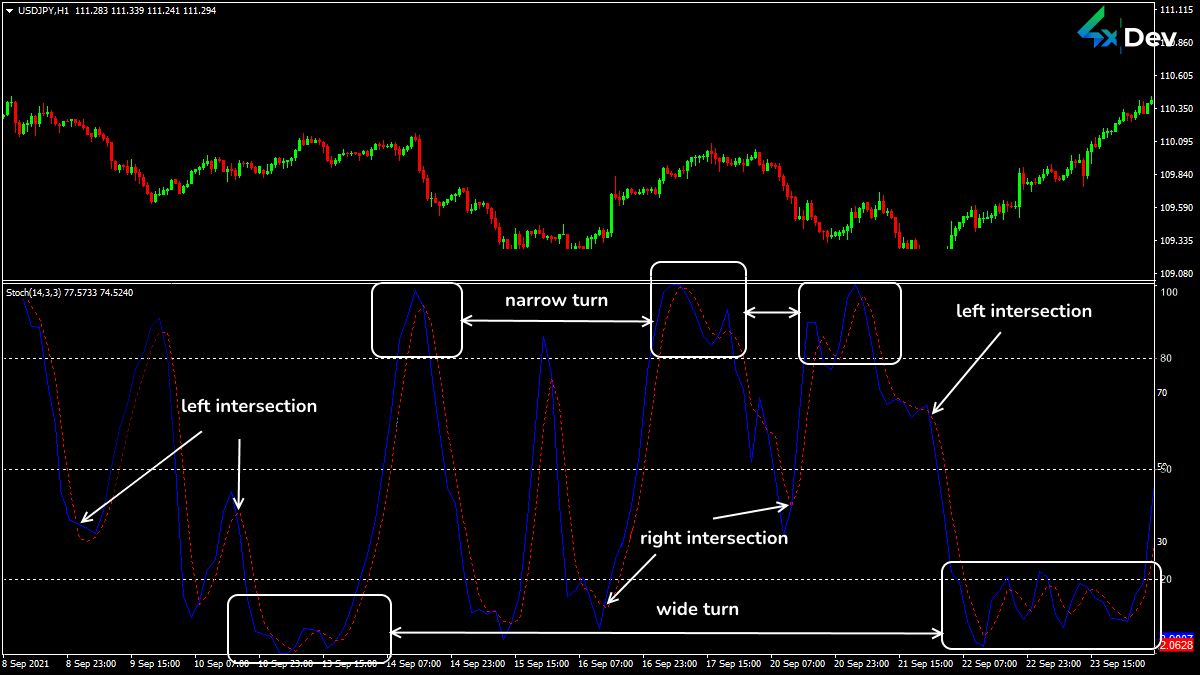
Stochastic fans distinguish:
- Narrow pivot point
- Wide pivot point
- Right line crossover (it is the most reliable signal)
- Left line crossover
 Qualitative Assessment of Stochastic Lines Behavior
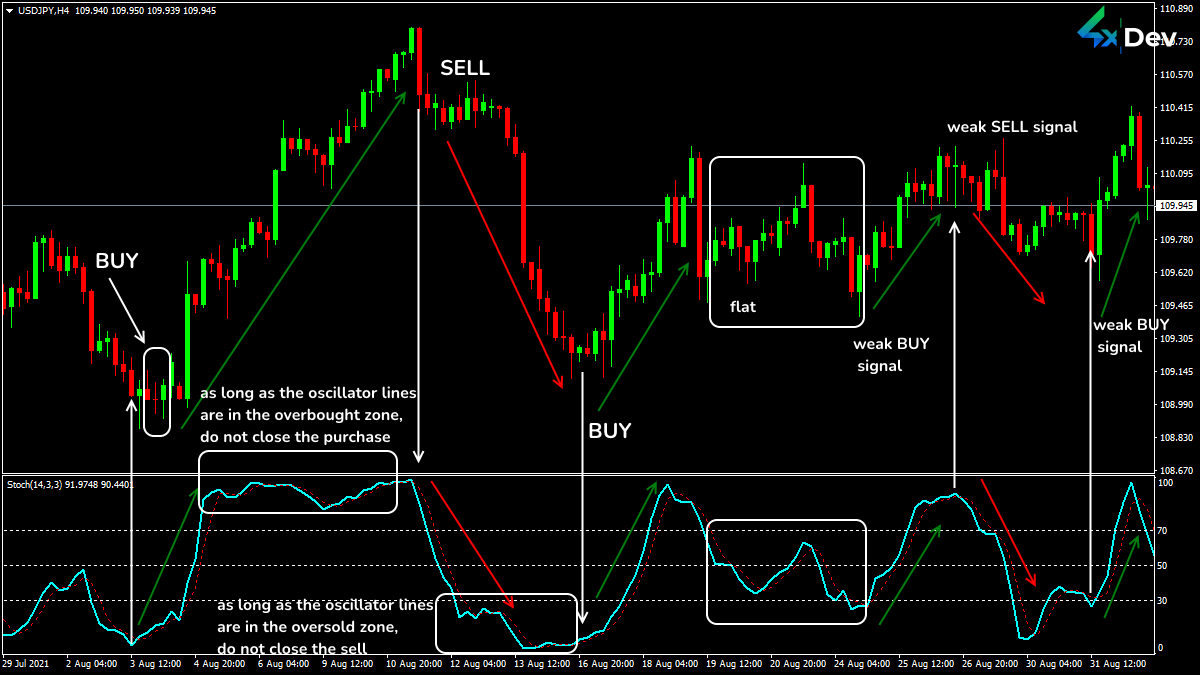
Price behavior in critical areas
| If | Then |
| The lines break down the overbought area 80(70) in a bullish market |
The current growth slows down A downward pivot is possible Get ready to SELL |
| The lines break down the oversold area 20(30) in a bearish trend |
The current fall slows down An upward pivot is possible Get ready to BUY |
 Stochastic Pivot Points
Consider the shape of the line pivot point:
- If the extremum is sharp and narrow, the trend will be strong and fast (after the pivot momentum).
- If the lines move in the critical area, the trend will be weak but stable.
 Dynamics in the Critical Areas
Note! Do not open trades if the indicator lines are entering the critical area. The trend is “alive” while the Stochastic indicator is in the critical zone. The reliable trading signal is a pivot point.
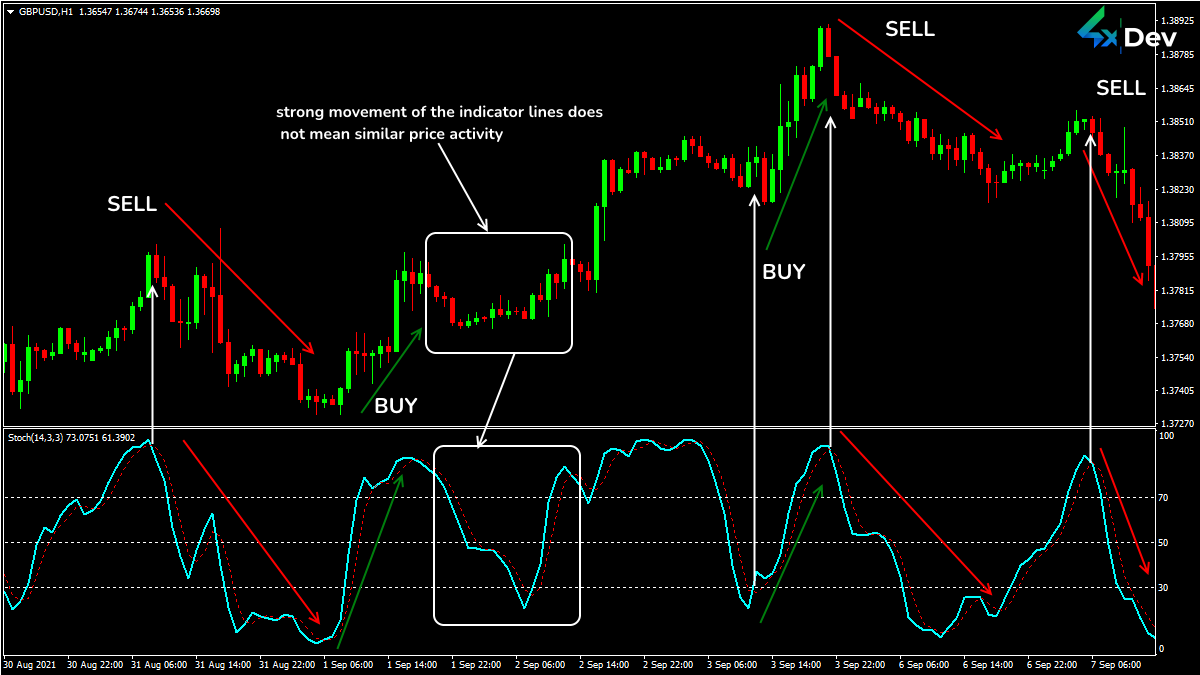
Stochastic lines divergence with price direction
It is a rare but strong momentum that is ahead of the real pivot by 2-5 bars.
| If | Then |
|
The price generates new local High Indicator lines are lower than the overbought area |
SELL Put StopLoss higher than the local max |
|
The price decreases (the local Low is renewed) Indicator lines are higher than the oversold area |
BUY Put StopLoss lower than the local min |
Stochastic Divergence
Equity line breakdown
50 level is the border of the bullish (50-100) and bearish (0-50) areas.
So, after a pivot point on a strong trend, the price should reach the balance line. There is usually a pause after that. While the indicator is near the central line, there is a lull in the market.
Buyers become stronger when the balance line is broken down from bottom to top (and it continues to rise). If the line is broken from top to bottom, the sellers rule.
You can open a trade after the breakdown of the balance line (50).
Using in Trading Strategies
You can use this indicator as a basic oscillator. It means Stochastic should adapt to your trading style.
- Short-term parameters will help catch the reversal moment.
- Long-term parameters will eliminate false signals.
Let’s take a closer look at several methods of applying Stochastic.
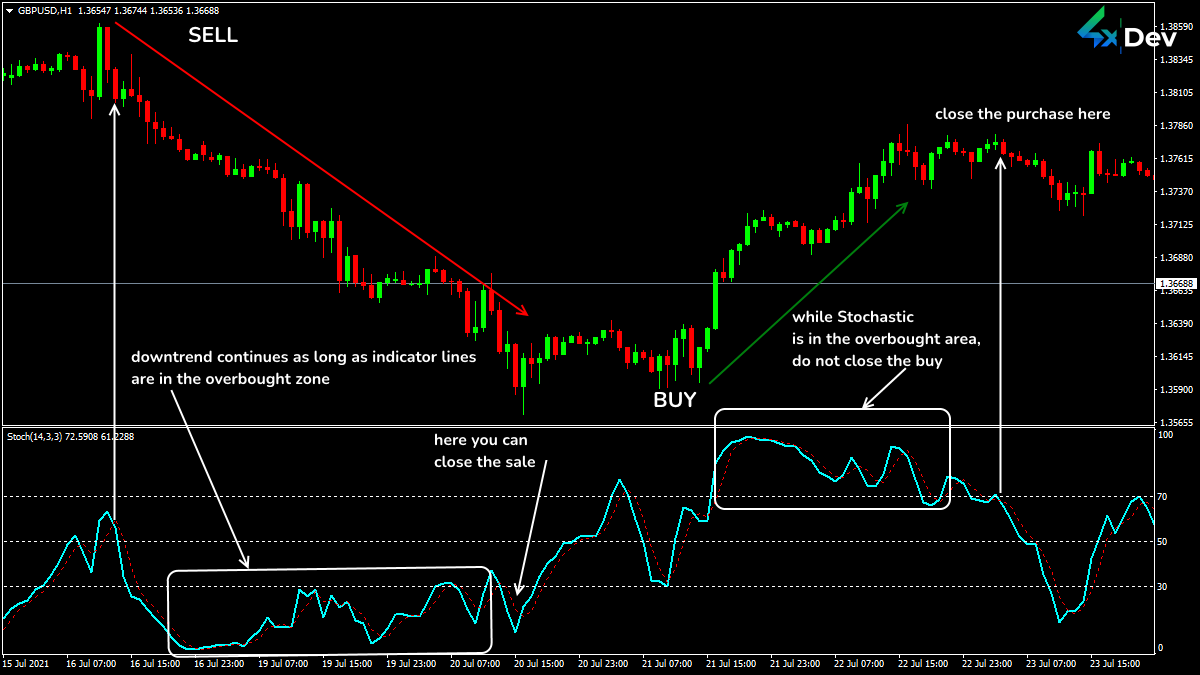
Stochastic +Stochastic
Use two indicators with different parameters: Fast and slow.
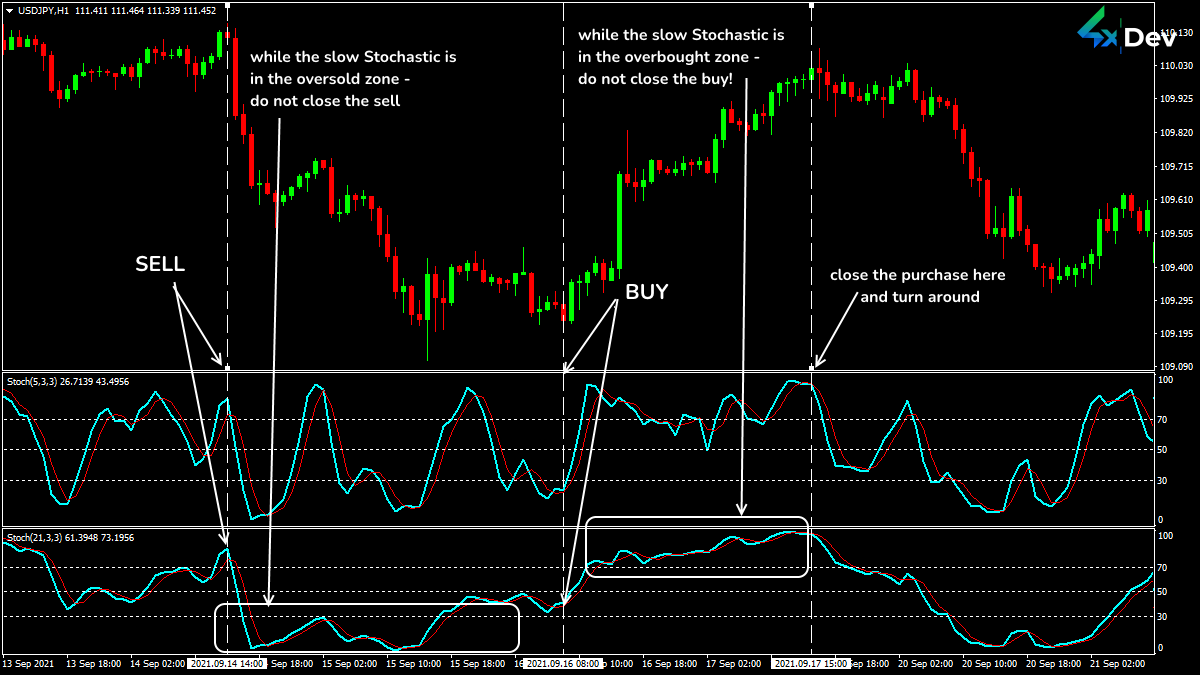 Trading Signals Scheme of the Stochastic+Stochastic Strategy
Stochastic+Oscillator
Use oscillators with different calculation algorithms that improve signal reliability.
Select a timeframe not lower than H1 for such a strategy. Otherwise, the difference between the indicators will be ineffective.
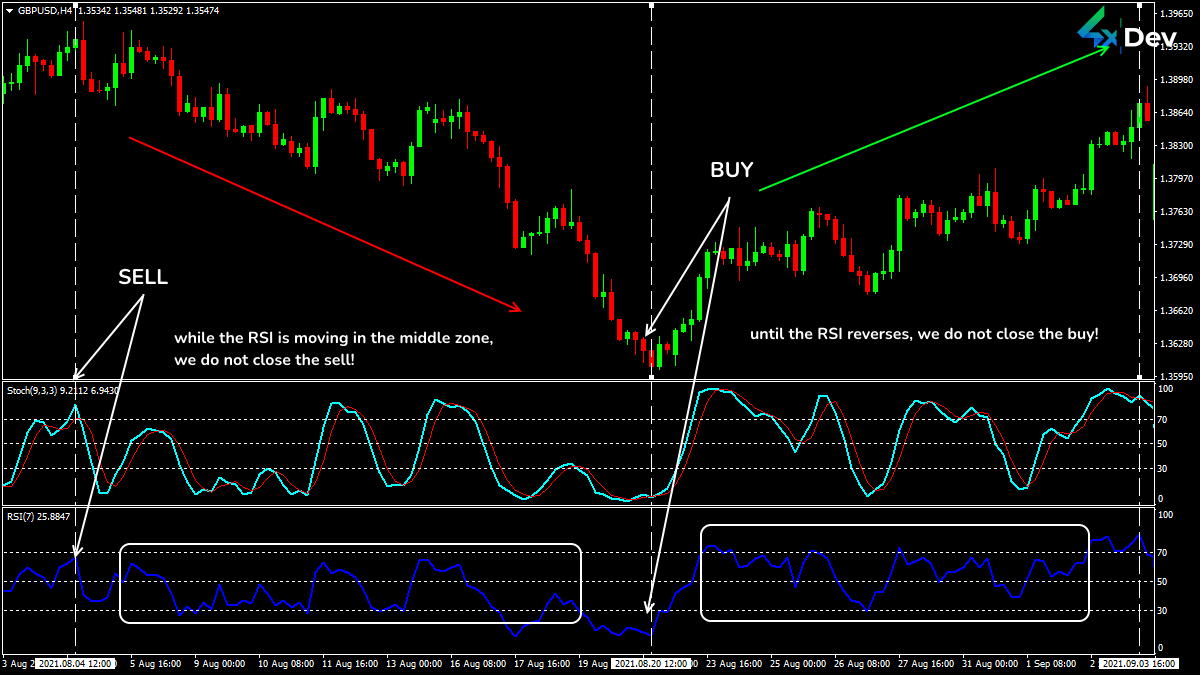 Different Trading Situations of the Stochastic Oscillator+RSI Strategy
Stochastic+Trend
You can analyze the trend with any tools: MAs, PSAR, or channel indicators. Stochastic should confirm the trading signal.
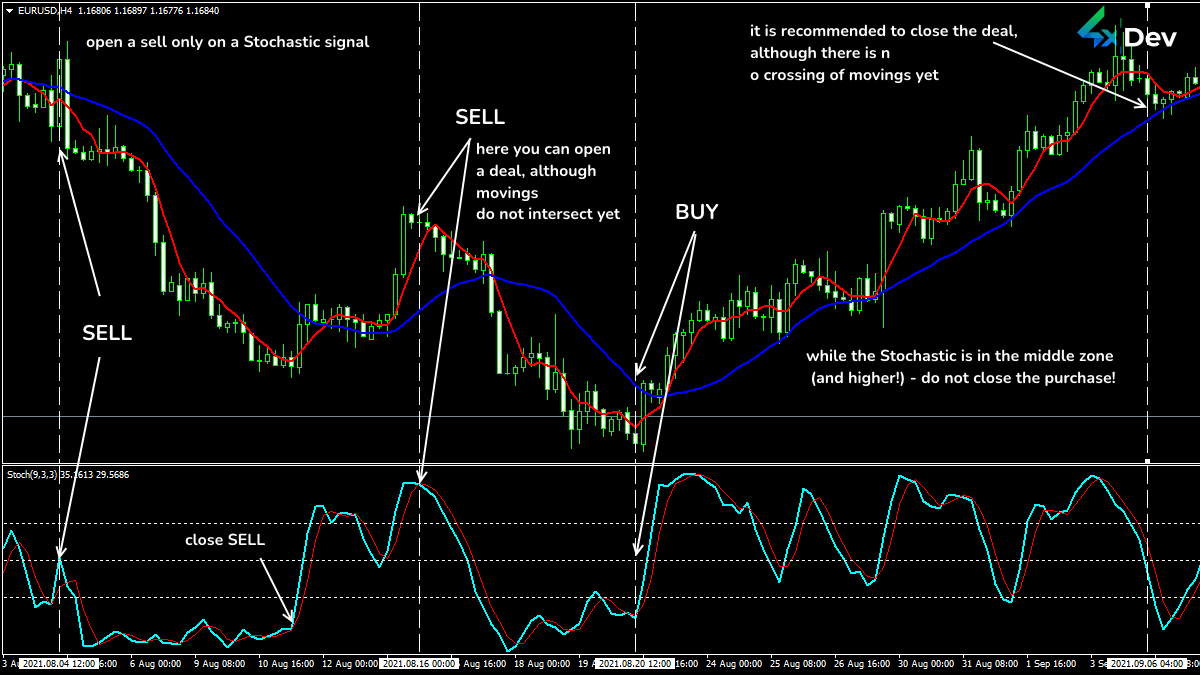 Trading Signals Scheme of the Stochastic Oscillator+2 MAs
Stochastic+MACD
Usually, the dynamics of MACD are ahead of Stochastic. The cross of its lines indicates a signal.
If Stochastic reacts first, it is a reason to close the trade. Select a timeframe from H1 and above.
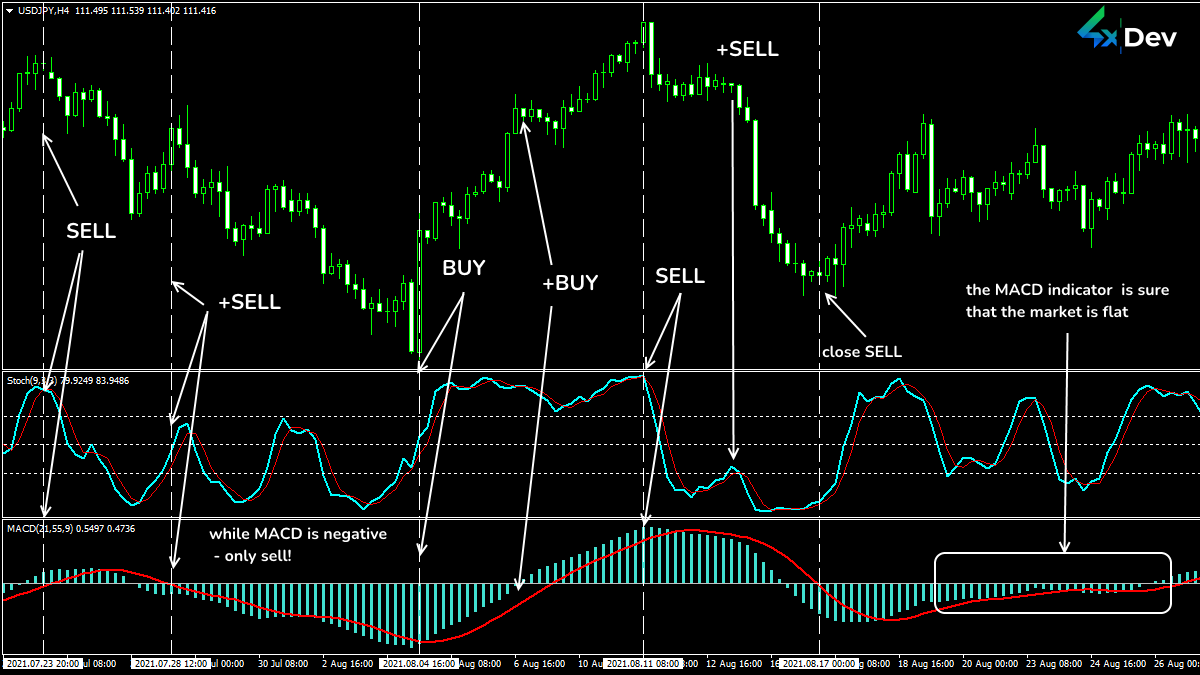 Trading Situations of the Stochastic Oscillator+MACD
In Conclusion. What Should I Do?
Do not consider the Stochastic critical areas breakdown and the line’s reversal as an immediate exact entry. Analyze the general trend.
Stochastic requires wide price ranges or non-speculative movements to work correctly.
The indicator sticks in the critical zone on a strong volatile trend. In this case, it practically does not give helpful signals.
In this case, the loss of good entry points (or the appearance of false signals) is possible.
Do you want to create a custom indicator? Leave your request and get the best tool.

Do you doubt the reliability of the indicator? Want to check if there is no redrawing? Need an expert programmer to develop a custom Forex indicator? We will do it for you! Just fill in a form and get a free estimate of the price and time needed to develop the desired tool.