Candles Patterns Indicator
for
MetaTrader 5®
The Candles Patterns indicator simplifies the search for patterns. You do not need to peek in every bar. Candles Patterns will take care of it. All you need to do is monitor its signals and make the right choice.
Trading has never been so simple and exciting! We have created this indicator for you. Try it!
Works on MetaTrader 5®
MetaTrader 4®, MetaTrader 5®, MT4®, MT5® are the registered trademarks of MetaQuotes Software Corp. | 4xDev.com is not associated with MetaQuotes Software Corp.
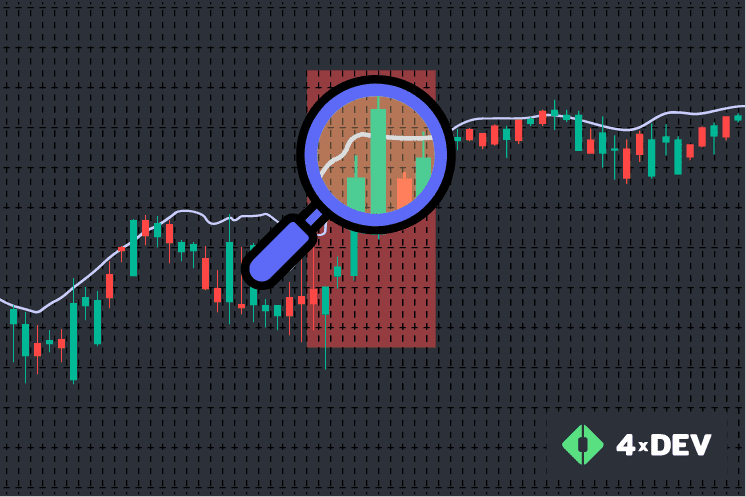
The Idea Behind the Indicator
It is the informative indicator that displays candlestick patterns on the chart. It works on any trading tool available in MetaTrader 5®.
The Candles Patterns indicator shows its name on the chart to recognize the candle pattern. If that pattern has more than one candle, the tool will circle the square on this pattern.
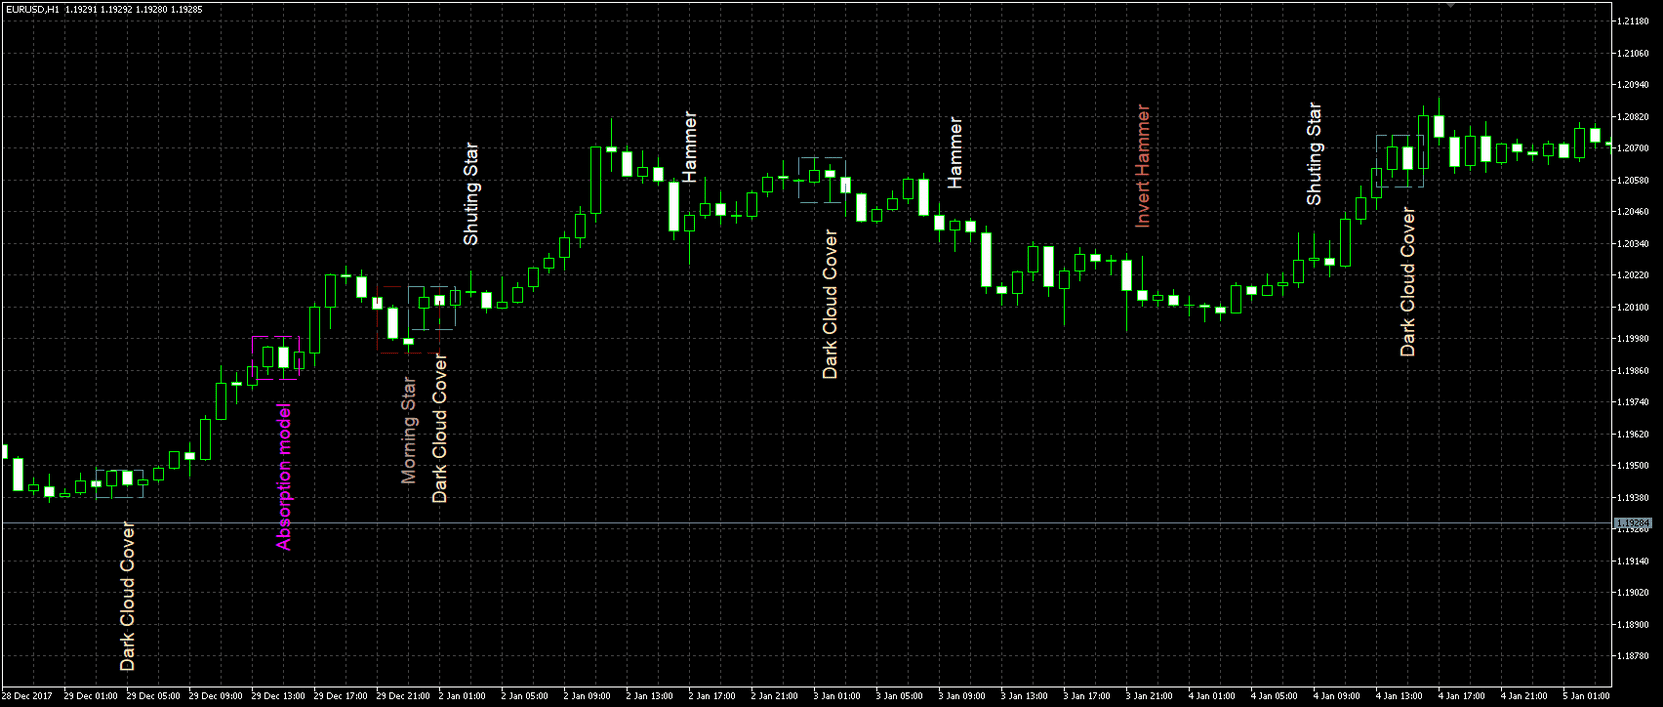 Candles Patterns on the Chart
Indicator Parameters
 Input Parameters
This tool has plenty of parameters. We create them to ensure you can change the interface to your needs and preferences.
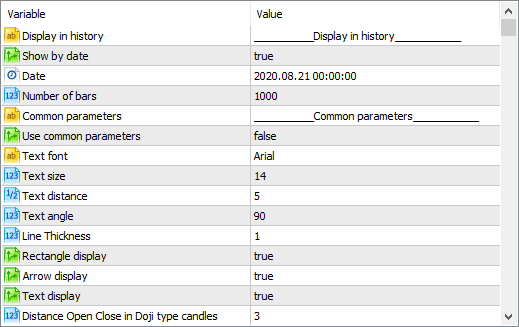
First of all, there are patterns of displaying the parameters on history:
- Show by date — on-off keying to pattern display function since the given date.
- Date — the date input field that starts the patterns display (it requires turning on Show by Date option to work tentatively).
- Number of bars — the input field for the sequence number from which the patterns displaying will begin (if the Show by Date option is enabled).
General parameters are the options used in every pattern:
- Use common parameters — common patterns will be used for all patterns if the parameter is activated.
- Text font — the text font name (manual input is necessary).
- Text size — changes the text size.
- Text distance — the distance from the bar to the text of the pattern.
- Text angle — the text slope.
- Line Thickness — the thickness of lines.
- Rectangle display — squares display (it works with patterns using more than one candle).
Every pattern has the parameters helping outline it from others:
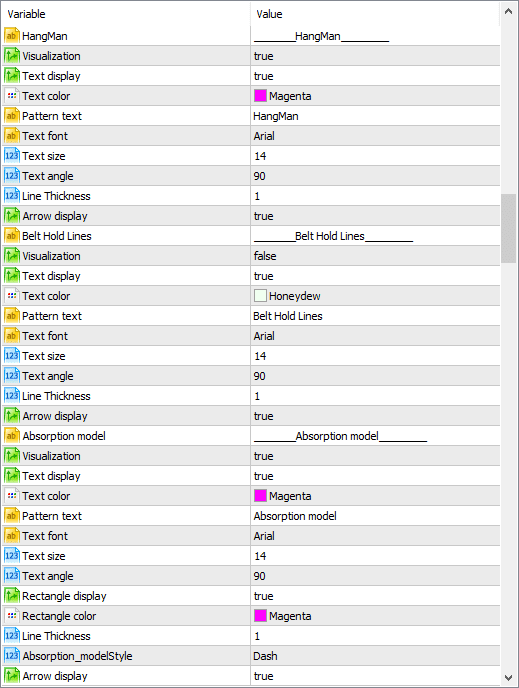 Visualization. Parameter for Patterns' Display on the Chart
Visualization is a parameter responsible for pattern display on the chart:
- Text display — pattern name display.
- Text color — the color of the pattern name.
- Pattern text — the input field of the pattern name (it has the default name).
- Text font — the text font name (needs manual input).
- Text size — changes the text size.
- Text angle — the text slope.
- Rectangle display — squares display (it works with patterns that use more than one candle).
- Rectangle color — the color of the square.
- Line Thickness — the thickness of lines.
Style — the style line (it works only when Line Thickness = 1).- Arrow Display — arrows display (it works when the Text Display option is off).
Installation
This indicator should be installed in the MT5® platform in a standard way. After the installation, drag the tool on the currency pair chart you want to work with.
It is better to set the time interval from an hour (H1) or more. There will be more false signals on the smaller intervals. The best option is to use the indicator on the daily (D1) interval. In this case, signals are the most accurate.
How to Work with an Indicator?
The Candles Pattern indicator searches for the patterns you chose in settings. After pattern finding, it points to the name on the chart if the pattern consists of more than one candle. It marks these candles in addition to better clarity.
This indicator is the right decision for beginners since newcomers will not have to look at the chart constantly. Moreover, it helps to remember all the patterns faster. Also, this indicator will be helpful for skilled traders to determine the direction of the future trend based on the indicator’s signals.
The indicator can successfully determine more than 20 popular candle patterns. The most popular are:
- Doji
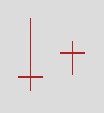
The candlestick looks like a cross, an upside-down cross, or a "plus" symbol.
The Doji appearance shows the market uncertainty in the candle analysis. It is similar to a tug-of-war between bulls and bears.
- Dark cloud cover
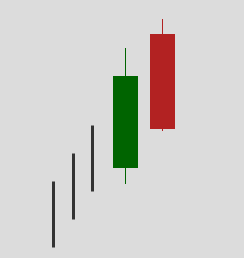
It is the bearish reversal pattern of the candlestick analysis.
- The first candle is a bullish one with a big body.
- The second one is bearish (with an opening price that is higher than the closing price).
The closing price is lower than the midpoint of the previous candle’s body.
Such a model often appears when all of the positive is won back at the end of the news sudden speedy moves.
- Dragonfly Doji

It is the Doji candle with a long lower shadow and an absent upper one. This pattern is one of the trend turn signals. The bulls no longer have the strength to breach the opening level and further grow.
The signal increases when there is a big upward candle before the advent of Doji.
- Gravestone Doji

This Doji has a very long upper shadow and a short lower one. The trend signal turns up particularly strong if a downward candle preceded it with a massive body.
- Engulfing pattern
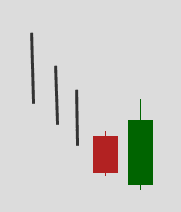
It is the reversal pattern of the candle analysis that can be either bullish or bearish.
The bearish engulfing pattern has arisen on the uptrend, while the bullish engulfing pattern is downward. The first candle of the pattern is formed with a small body. The body of the second one fully covers or absorbs the body of the previous candle.
This situation shows that the previous trend strength is fully completed, and the trend turn is happening with a firm dynamic.
- Evening star
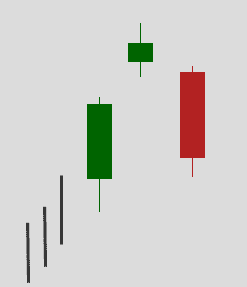
It is the bearish reversal pattern of the candle analysis.
The bull candle with a massive body has arisen on the uptrend. Then there is the gap and the second candle with a small body. The third candle is closed lower than the midpoint of the first candle’s body.
This candle analysis model is due to a sudden trader’s mood change when the generally positive economic move is interrupted by negative news. For higher time frames (Daily, Weekly), this behavior can testify in trading in a narrow range while waiting for the crucial occasion that should have the expected beneficial consequences.
Technical Requirements
There are some technical requirements that you need to follow for loading and correct work of the indicator:
- A computer with all the necessary conditions for the MetaTrader 5® installment.
- The desktop version of MetaTrader 5® installed on your computer.
- The computer working hours should match the trading hours. The MT5® platform must be launched.
- The installed tool must be configured on the MT5® chart.

If you are interested in a custom indicator, you can order it here.
A ready-made form will help you not to forget important aspects of your technical specification.
You are free in your final choice and let it be the right one. Everyone profits!
All Products are provided “as is” without any warranties regarding effectiveness, performance, or suitability for particular purposes. The actual performance of the Products could be different from testing results and your expectations.
Please study carefully all information about the Products before purchasing.
The amounts paid for the Products are non-refundable.
4xDev assumes no liability for any direct or indirect losses resulting from the use of the Products.