Multi-Time Period Chart
for
cTrader
This indicator represents long-period candlesticks displaying on the current chart. It draws rectangles that show information about candlesticks using a given period:
- Maximum and minimum candlestick price
- Opening and closing time
- Colors (red determines bullish; blue — bearish)
Trading has never been so simple and exciting for you. Try this indicator now!
Works on cTrader
The Idea Behind the Indicator
You can switch between high-level periods by clicking on the button of the given period located in the top right corner. By clicking, the indicator will automatically redraw rectangles on that period.
Also, the tool has a function of displaying the high-period-candlestick tick volume. You need to click the right rectangle on the chart. After repeated clicking, the data is hiding out. The tick volume is displayed in the left top corner by default.
If you add an indicator to the chart, it will automatically draw rectangles of the high-period candles. If you select the maximum period (MN), the tool will not function.
The tool does not need any configurations and does not have any in-parameters.
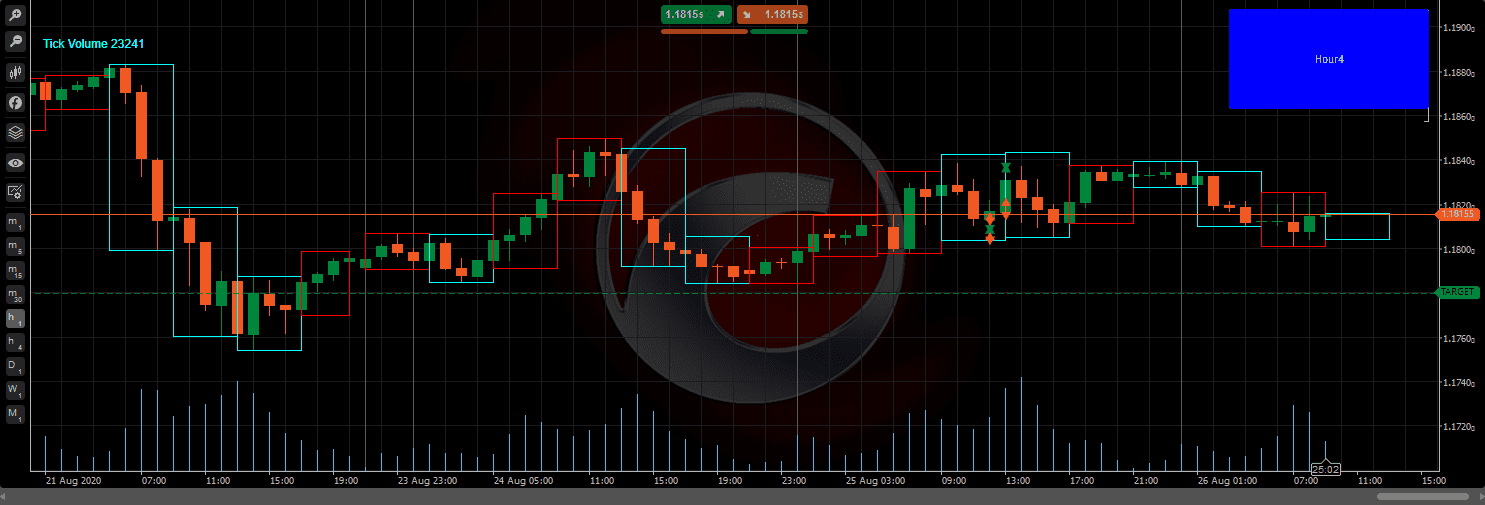 The Indicator on the H1 Chart
The H1 chart indicator shows the H4 chart candlesticks by using rectangles.
The tick volume is displayed in the top left corner of the chart after pointing to one of the rectangles. The period name displayed by the indicator has been written on the button in the top right corner.
You can see the example of Daily period candlesticks on the same H1 chart. After clicking the button, rectangles are immediately altered under a given period.
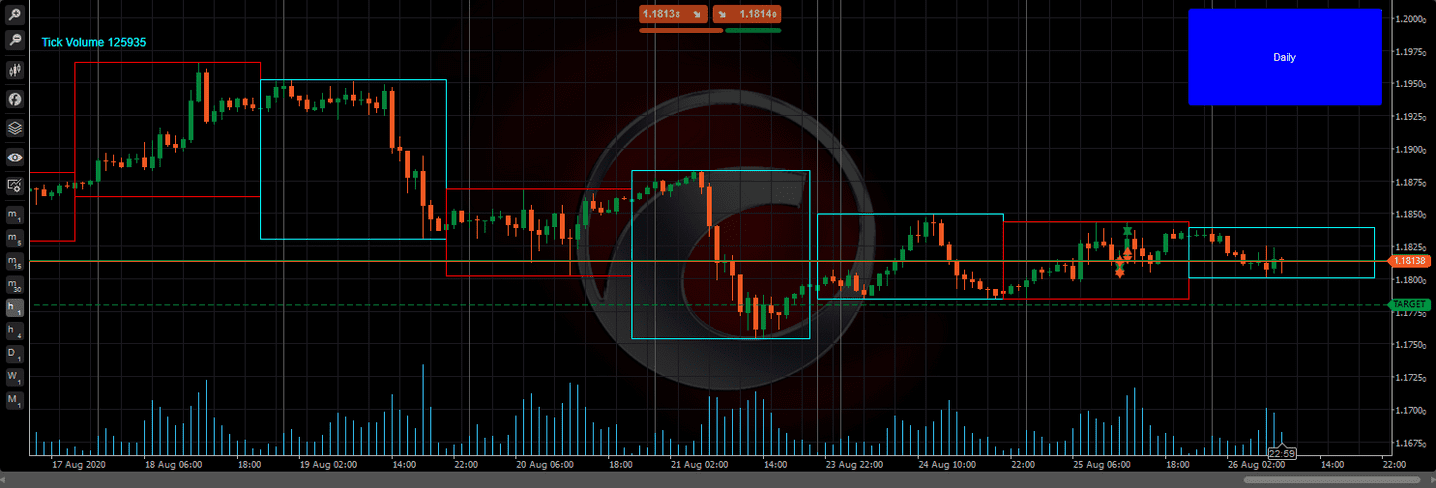 The Indicator on the D1 Chart
The indicator is working with low-level timeframes only. If you choose the maximum period, the tool will not function. The "Choose another" inscription will appear.
Installation
Copy the folder in the "Indicators" folder. You can find it by clicking the right mouse button on any indicator —> “Show in Folder” in the "Automate" tab of the cTrader main window.
Then you need to compile the project in the same tab by clicking "Build Indicator".
Technical Requirements
Here is what you need to load the indicator:
- A computer with all the necessary conditions for the cTrader installment.
- The desktop version of cTrader on your computer.
- The computer working hours should match the trading hours. The cTrader platform must be launched.
- The installed tool must be configured on the cTrader chart.

If you are interested in a custom indicator, you can order it here.
A ready-made form will help you not to forget important aspects of your technical specification.
You are free in your final choice and let it be the right one. Everyone profits!
All Products are provided “as is” without any warranties regarding effectiveness, performance, or suitability for particular purposes. The actual performance of the Products could be different from testing results and your expectations.
Please study carefully all information about the Products before purchasing.
The amounts paid for the Products are non-refundable.
4xDev assumes no liability for any direct or indirect losses resulting from the use of the Products.