Bollinger Bands Indicator: In Search for the Optimal Trend
- Logic, Purpose, and the Calculation Method
- Parameters and Settings
- Indicator Trading Signals
- Using in Trading Strategies
- In Conclusion. What Should I Do?
Logic, Purpose, and the Calculation Method
The idea behind this indicator was developed by Perry Kaufman in 1987. John Bollinger, the analyst, provided a modern interpretation of this tool. Oh, these trading genii!
Bollinger Bands forms a classic dynamic channel based on the current volatility changes. It is a top indicator for trend analysis of price areas and reversal points.
The BB price envelope works perfectly on all currency pairs and in all market conditions.
The market efficiency hypothesis states: "The market constantly returns (or reverses) the price to the value area (so-called trend). In this case, traders should determine the price direction. Also, they need to realize how to trade efficiently on the way to the reversal point." What a brain tester!
For example, you can manage the situation in the price channel with dynamic but rather rigid boundaries.
The price spends more than 70% of the market time within two standard deviations. And 80—95% of the time, it is in the three standard deviation range. In fact, Bollinger Bands uses this aspect to create channel boundaries.
The indicator:
- Determines the current price location concerning the typical trading range.
- Evaluates the distance from the current price to the reversal point.
- Calculates volatility using the standard deviation value.
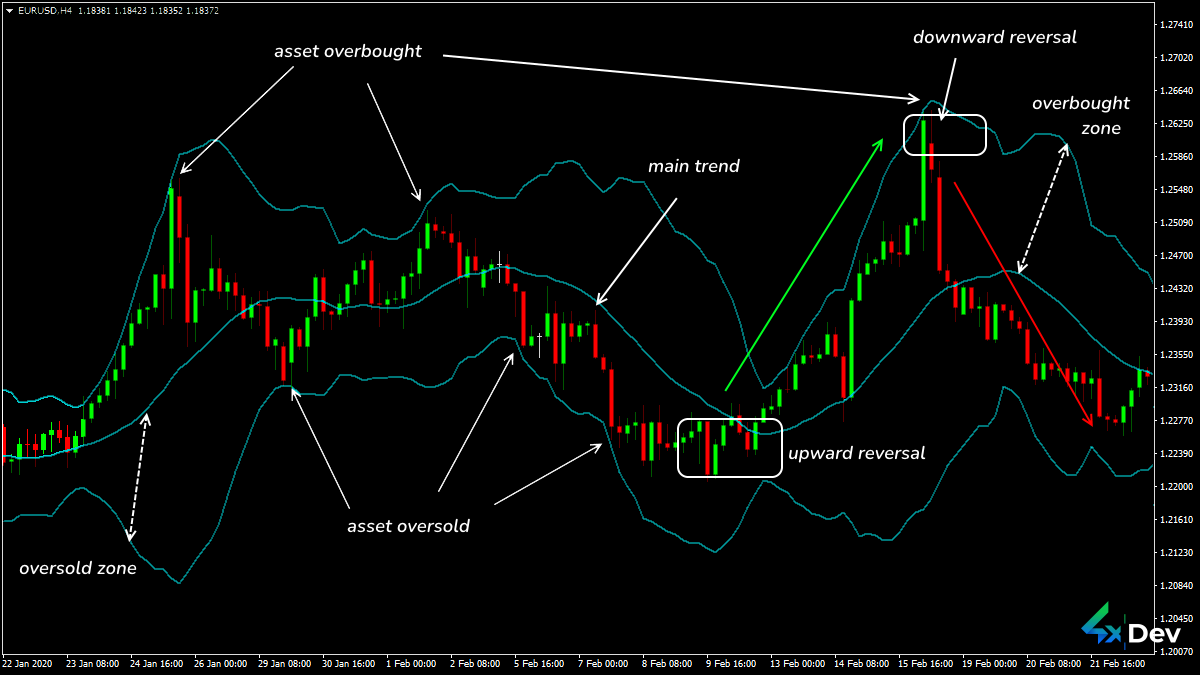 Market Analysis Using Bollinger Bands
The indicator generates 3 dynamic lines on the price chart:
- The central line is a basic MA of any type (most often a closed one).
- The upper and lower bands are shifted symmetrically upward or downward concerning the central one.
They move by a certain number of standard deviations during analysis:
UpperBand = MovingAverage + (K * StandardDeviation)
LowerBand = MovingAverage — (K * StandardDeviation)
The calculation mechanism adjusts the channel width: asset volatility affects the number of deviations.
Note! There must be at least 90% of the price movements inside the channel.
If the price is near the upper band, it is located in the overbought zone. If it goes down to the lower line, it is in the oversold zone. What an easy-peasy equation!
Let’s take a closer look at this phenomenon!
Parameters and Settings
All trading platforms had the standard version of the Bollinger Bands indicator included in the bundle of other indicators. As a rule, all the basic parameters are the same. However, there are additional color and sound notification settings built-in to some variations of the product.
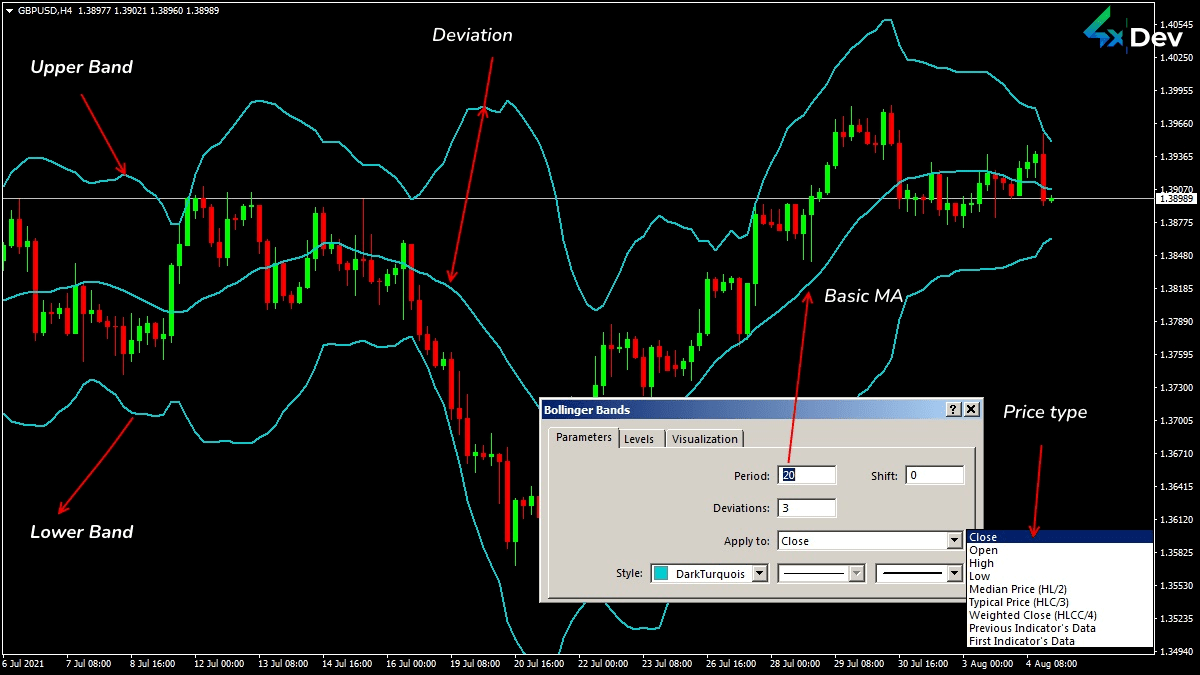 Parameters and Settings of Bollinger Bands in MT4/5®
The head BB parameters are:
Period (in bars)
The best range for this parameter is from 13 to 30.
For example, the default (20) works well on assets. You can also find guidelines for using Fibonacci numbers or round values (50, 100, 150, 200). However, they will not add effectiveness to the BB indicator.
Note! The higher the period, the lower the band sensitivity. This is especially detrimental to the currency pairs with low or medium volatility.
If there is a frequent price breakdown, increase the parameter.
If the price touches the upper or lower area rarely, decrease the parameter (period).
The appearance of the figures “Double Bottom” (near the lower border) or “Double Peak” (near the upper band) allows you to analyze the price action. The second key point must always be inside the channel. If the bottom or top is outside the line, increase the period.
Use different values for different timeframes:
- From M1 to M15 — 10
- From M15 to H1 — 20
- From H1 to D1 — 50
- Over D1 — 60
Price Type
Use the Close price for assets or average and typical prices for too volatile instruments.
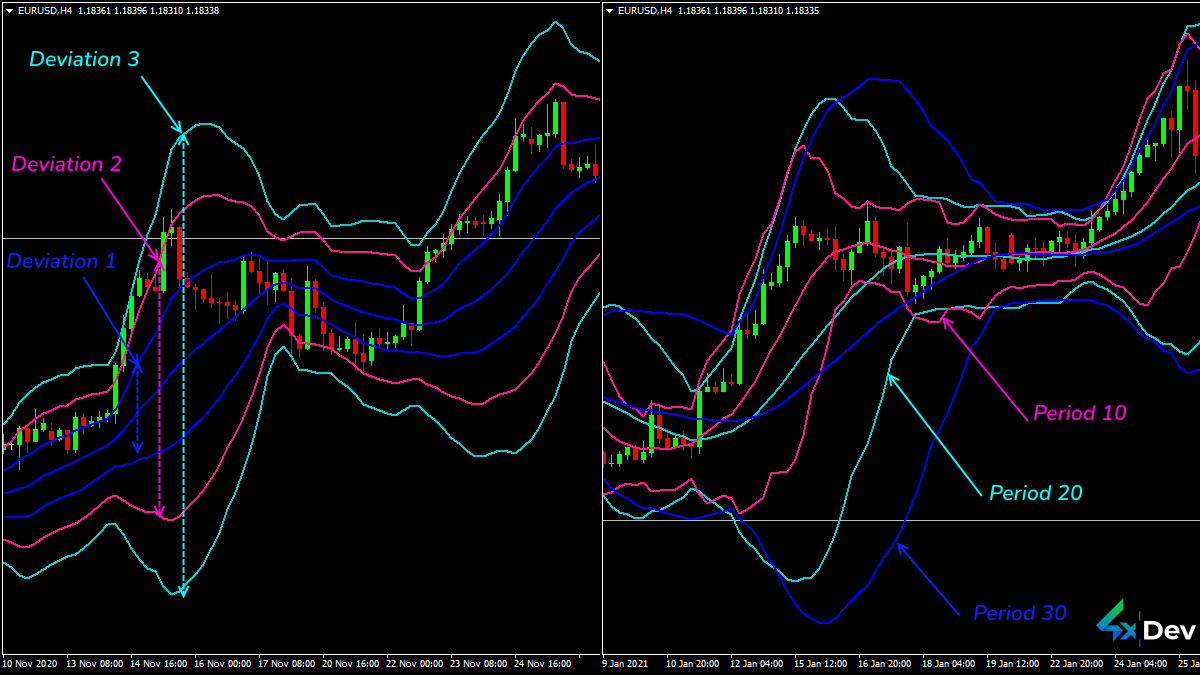 Parameters Influencing the BB Line Shape
Standard Deviation
This parameter selects a value in the range of 1—5 and is calculated by the indicator automatically. If the parameter increases, the channel expands. And vice versa.
The default value (2) is used for instruments with stable volatility.
Removal
The parameter corrects the current lag. It is used extremely rarely.
Note! You can combine all the parameters to get more accurate results. Strength in numbers, bro.
Indicator Trading Signals
The Bollinger Bands central line shows the current trend accurately:
- Bands are almost parallel in flat, and the price moves exclusively within the channel.
- The slope represents the market strength and direction in a trend. The larger the angle, the stronger the trend.
The bullish market is pushing the bands up. Therefore, the price skyrockets above the central line on an uptrend.
In a downtrend, the channel moves down. The price falls below the middle band (in the SELL zone).
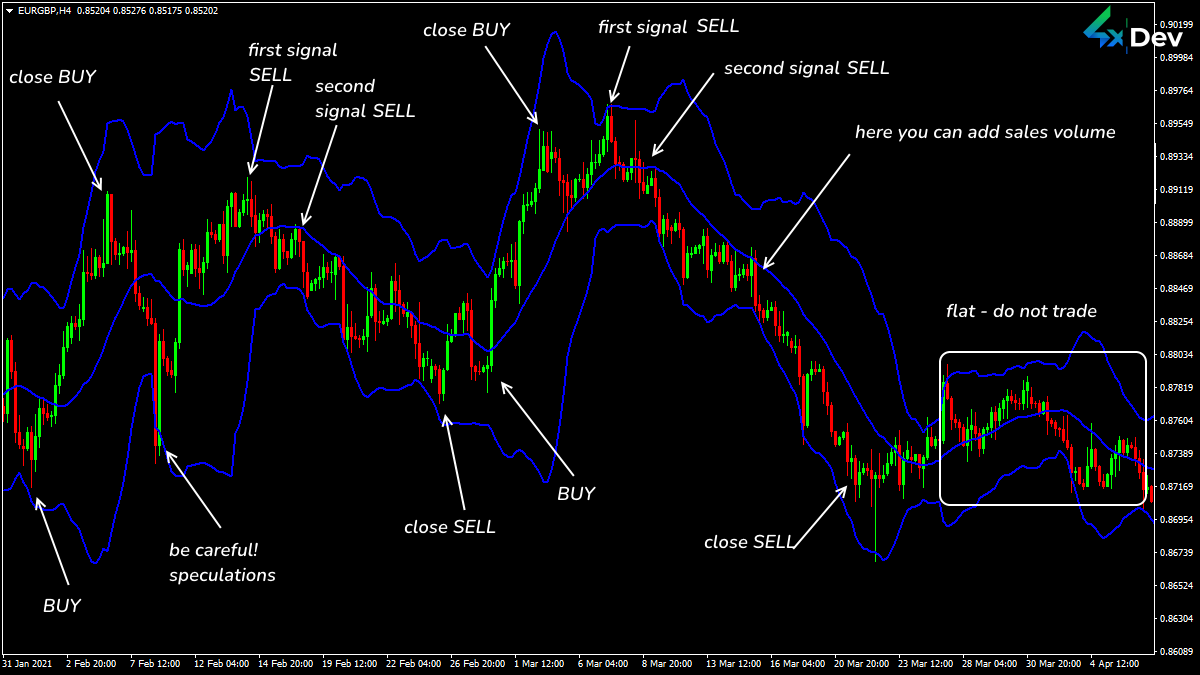 Standard Bollinger Bands Trading Signals
The trading signal is:
- When the price reverses from the upper or lower band to the opposite channel border (or to the central line).
- Channel border breakdown with the further movement along with the current trend. If this movement is above the upper border — BUY. If it is under the lower band — SELL. Do not spoil it!
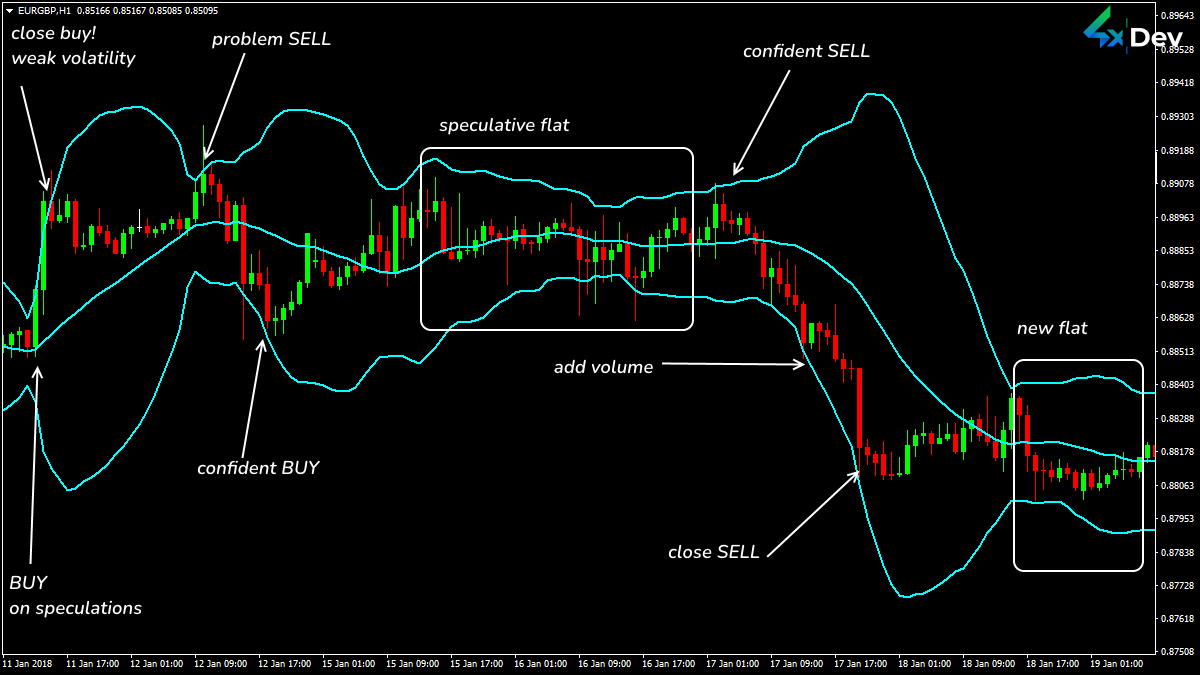 Typical Trading Situations of the Bollinger Bands Indicator
The bandwidth depends on the volatility:
- The range expands. Volatility increases. The current trend is increasing, too.
- The bands converge. Volatility decreases. The current direction weakens.
Dynamic bands are used as solid overbought/oversold zones and support/resistance levels. Breaking the lines is extremely rare.
Note! Entering the market on a rebound from the channel bands is less risky.
Using in Trading Strategies
The most popular methods are:
Price breakout of the band boundaries
A strong trend begins after a flat period. You have to open a position in the prevailing trend direction. Perform this after closing 1—2 candlesticks outside the band. Such a movement implies the standard volume dynamics.
The appearance of powerful market players causes a band breakdown. Trading against such a move is self-slaughter: your StopLoss can easily get knocked during high volatility. Be careful! And only then the price will reverse. Volume dynamics should increase sharply.
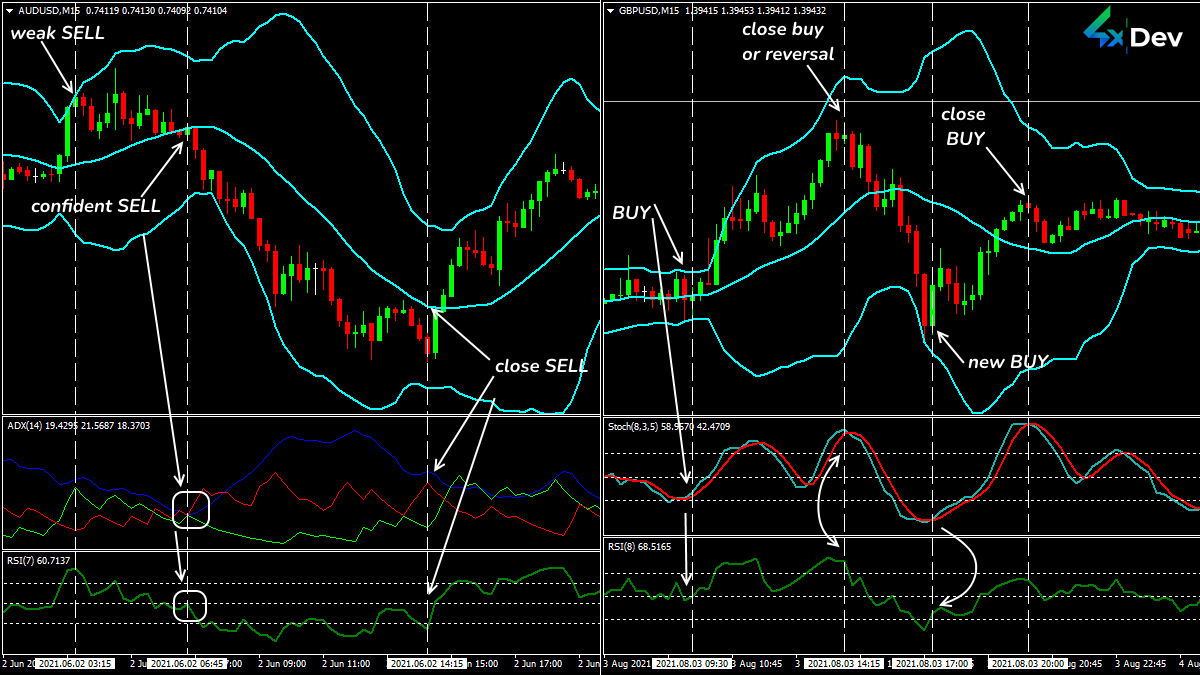 An Example of Bollinger Bands+RSI+ADX+Stochastic Strategies
BB graphical patterns
The method is to implement graphical reversal patterns. At the same time, key points appear in the channel boundary zone.
Reversal from the borders to the channel zone
Such a trading scheme requires a wide range. The breakdown of the central band (basic MA) strengthens the trading signal.
BB is used in strategies where trades are opened in the trend direction after a reversal. To confirm the end of a reversal, use a sensitive oscillator (Stochastic, RSI, or ADX).
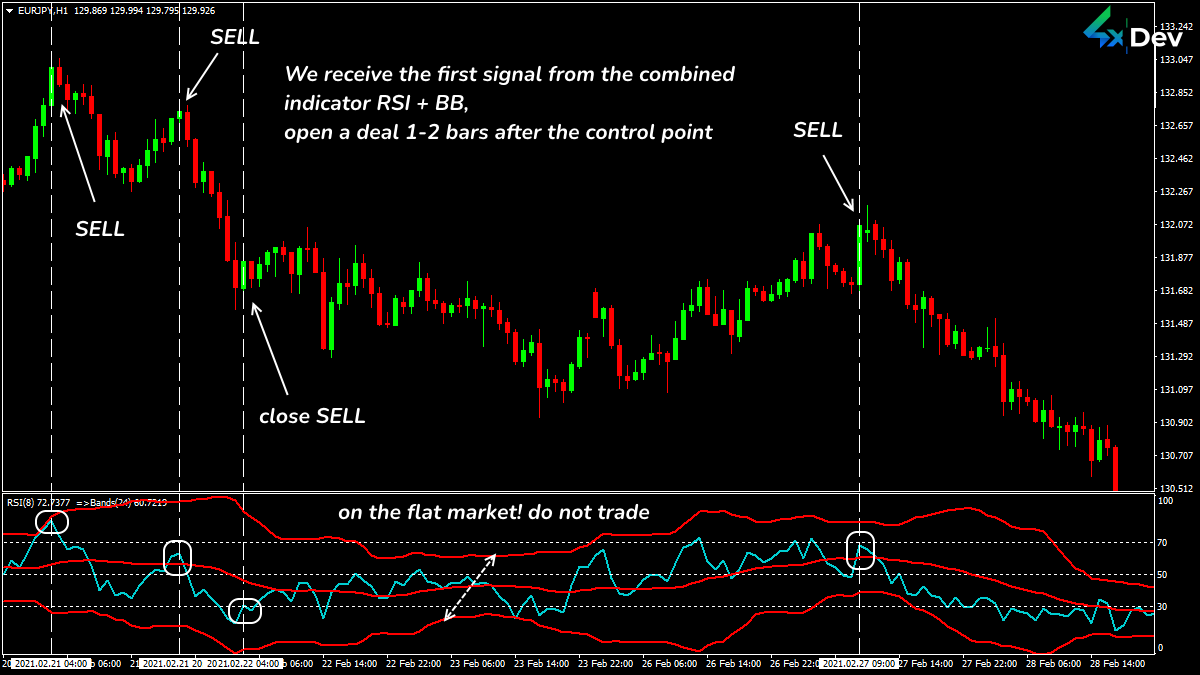 Hybrid RSI+Bollinger Bands Indicator
You can surf the Internet to find various BB versions combined with an oscillator. Yeah, in this case, the signal accuracy will decrease. However, nothing superfluous will be displayed on the price chart. Isn’t that a really big advantage?
The basic MA is functioning at a tough price level. So, a short-term flat is possible in this zone. Therefore, place StopLoss or TakeProfit.
In Conclusion. What Should I Do?
So, let's talk about the advantages and disadvantages of the Bollinger Bands indicator.
Pros:
✅ Clear trend identification.
✅ Correct assessment of market activity and the hidden nature of price fluctuations.
Cons:
❌ Lagging inheritance in all moving averages.
❌ The complexity of predicting price behavior in the channel band zone.
❌ The probability of BB line breakdown is higher than that of horizontal levels.
The Bollinger Bands Indicator is super duper helpful if you combine its capabilities with impulse indicators and volume analysis.
Per Aspera ad winning trades with 4xDev tools! Buy now to be the King of trading!

Do you doubt the reliability of the indicator? Want to check if there is no redrawing? Need an expert programmer to develop a custom Forex indicator? We will do it for you! Just fill in a form and get a free estimate of the price and time needed to develop the desired tool.
