Bollinger Bands Fibonacci Ratios Indicator
for
TradingView
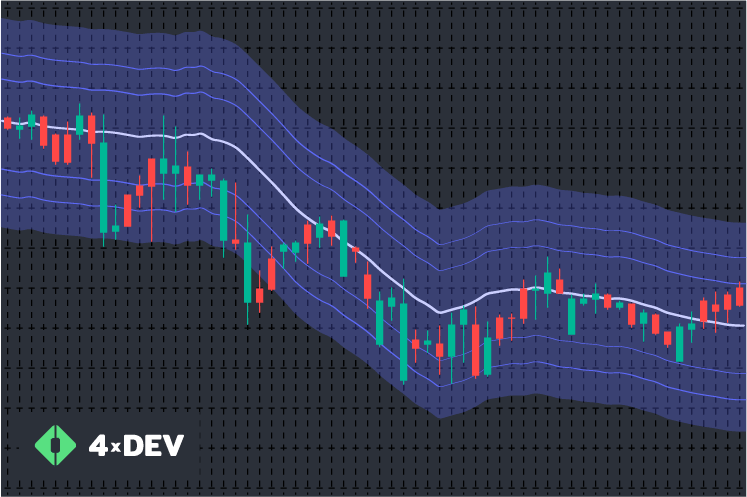
The Bollinger Bands Fibonacci Ratios indicator for TradingView is a tool that makes trading easy and relaxing.
Be assured, trading is a piece of cake!
Get an up-to-date trading tool that measures price volatility and allows you to monitor market trends. Determine future price movements thanks to our product!
Works on TradingView
The Bollinger Bands Fibonacci Ratios indicator has upper and lower volatility bands. However, instead of using the Standard Deviation, Smoothed ATR is applied in this tool.
After calculating the Smoothed ATR value, three upper and three lower bands are created by multiplying the ATR value by positive and negative Fibonacci factors (1.618, 2.618, 4,236). Then results are added to the mid-band based on the Simple Moving Average of the closing price.
The Idea Behind the Indicator
Traders use the Bollinger Bands Fibonacci Ratios indicator for trading shares and goods. Also, the tool is applied to monitor price volatility when the price reaches the upper or lower band. These ranges expand if the volatility is high. And vice versa. Volatility identification adapts a trading system to generate corresponding signals in time.
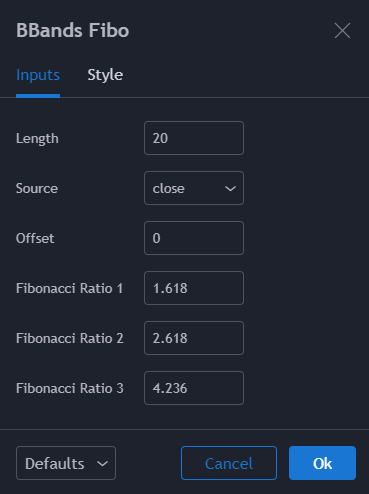 Default Input Parameters
Inputs:
- Length
- Source: open, high, low, close, hl2, hlc3, ohlc4
- Offset
- Fibonacci Ratio 1 is applied for the first upper and lower band calculation
- Fibonacci Ratio 2 is used for the second upper and lower band calculation
- Fibonacci Ratio 3 is applied for the third upper and lower band calculation
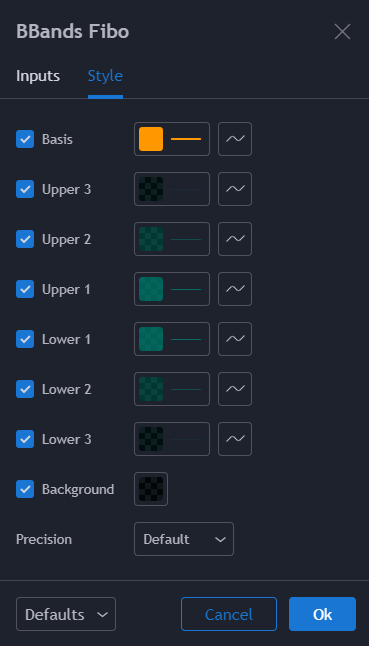 Default Style Settings
Style:
- Basis — sets the baseline color and style.
- Upper 3 — sets the color and style of the third upper line.
- Upper 2 — sets the color and style of the second upper line.
- Upper 1 — sets the color and style of the first upper line.
- Lower 1 — determines the color and style of the first lower line.
- Lower 2 — determines the color and style of the second lower line.
- Lower 3 — determines the color and style of the third lower line.
- Background — the background color within the third upper and the third lower bands.
- Precision — the decimal places of the indicator value.
The Indicator on Various Charts
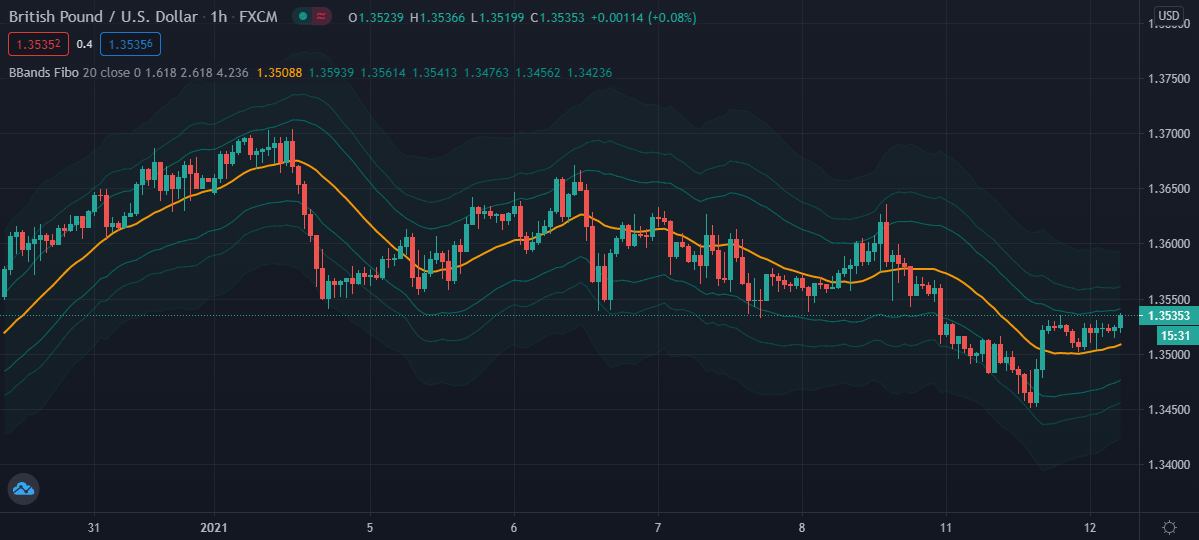 Bollinger Bands Fibonacci Ratios Indicator on the H1 Chart with Default Parameters
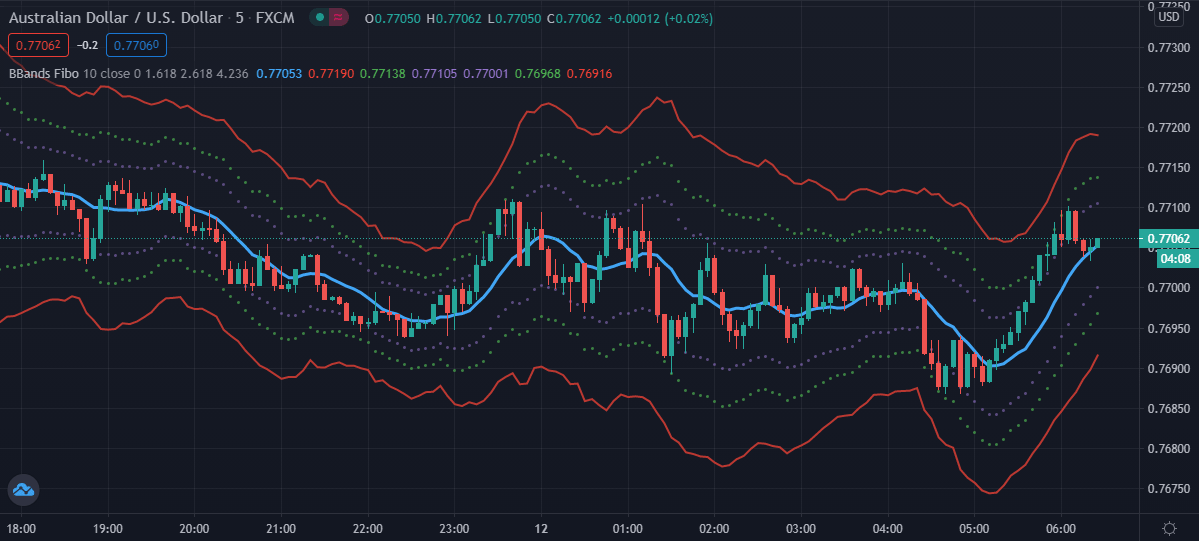 Bollinger Bands Fibonacci Ratios Indicator Depicted on the M5 Chart with Custom Parameters
Technical Requirements
Here is what you need to run this indicator:
- A computer capable of running TradingView.
- The computer working hours should match the trading hours.
- The installed tool must be configured on the TradingView chart.
Frequently Asked Questions
- What is your refund policy? All sales are final since downloadable products can not be returned. Please be sure you are using TradingView before buying. If you have issues with your indicator, contact 4xDev Support. We are happy to help.
- Will the indicator work with my broker? This indicator will work with any broker that uses the TradingView platform.
- Should I use a demo account? It is highly recommended that you use this indicator in a demo account before you trade live. Then you will get a feel for how it works.
- Can this indicator be used on more than one computer? You can use the tool on any computer you own.
- Does this indicator track timeframes and currency pairs? It will only track currency pairs and timeframes on opened charts (on which the indicator is attached and correctly configured).
- Does this indicator place trade? No, it does not. Therefore, you are 100% responsible for your trades and profits/losses.

If you are interested in a custom indicator, you can order it here.
A ready-made form will help you not to forget important aspects of your technical specification.
You are free in your final choice and let it be the right one. Everyone profits!
All Products are provided “as is” without any warranties regarding effectiveness, performance, or suitability for particular purposes. The actual performance of the Products could be different from testing results and your expectations.
Please study carefully all information about the Products before purchasing.
The amounts paid for the Products are non-refundable.
4xDev assumes no liability for any direct or indirect losses resulting from the use of the Products.
